
PMI-RMP · Question #344
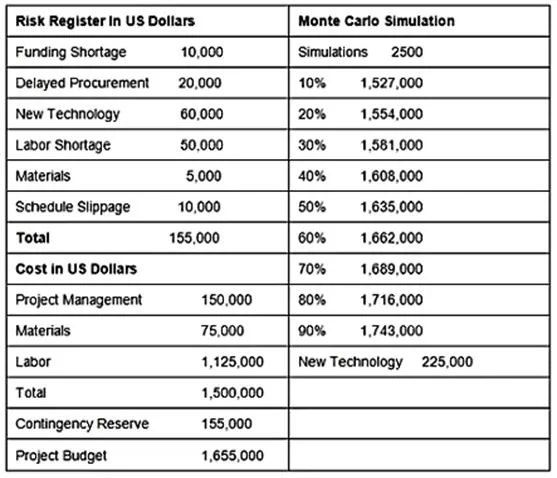
Given the output from the Monte Carlo simulation, what is the probability of a successful completion within the project budget?
The correct answer is C. 56% probability of meeting project budget. Monte Carlo simulations generate a probability distribution of outcomes (cost or schedule) based on thousands of random iterations using defined input ranges. The simulation output typically displays cumulative probability at various cost thresholds. Reading the S-curve or…
Question
Given the output from the Monte Carlo simulation, what is the probability of a successful completion within the project budget?
Exhibit
Options
- A30% probability of meeting project budget
- B46% probability of meeting project budget
- C56% probability of meeting project budget
- D60% probability of meeting project budget
How the community answered
(27 responses)- A4% (1)
- B15% (4)
- C74% (20)
- D7% (2)
Explanation
Monte Carlo simulations generate a probability distribution of outcomes (cost or schedule) based on thousands of random iterations using defined input ranges. The simulation output typically displays cumulative probability at various cost thresholds. Reading the S-curve or histogram at the project's defined budget value gives the probability that the project will finish at or below that budget. Based on the simulation data referenced in the scenario (though the table is not shown here), the cumulative probability at the stated budget falls at 56%, meaning there is a 56% chance the project will be completed within the defined budget. Values below 50% would indicate more risk; above 70-80% would be considered a high-confidence estimate.
Topics
Community Discussion
No community discussion yet for this question.