
PK0-004 · Question #602
Which of the following is the BEST reason to use a burndown chart?
The correct answer is B. To predict when project work will be completed. A burndown chart tracks the amount of remaining work (usually story points or tasks) over time. By observing the rate at which work is being completed, the team and project manager can project when all remaining work will reach zero - predicting the project or sprint completion…
Question
Which of the following is the BEST reason to use a burndown chart?
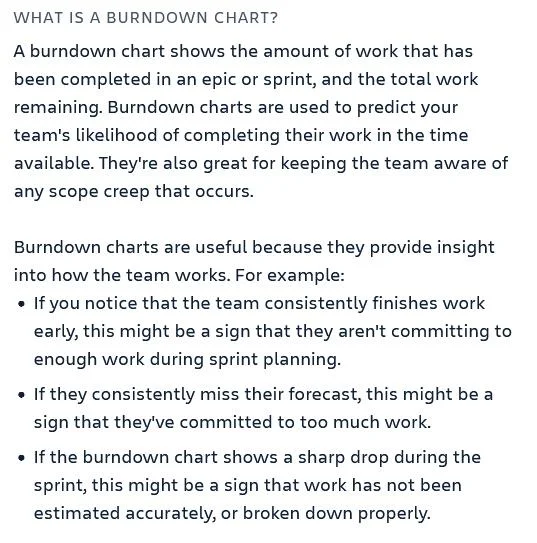
Exhibit
Options
- ATo determine how much risk is still associated with the project
- BTo predict when project work will be completed
- CTo establish a backlog for project deliverables
- DTo create a project charter
How the community answered
(40 responses)- A3% (1)
- B85% (34)
- C5% (2)
- D8% (3)
Explanation
A burndown chart tracks the amount of remaining work (usually story points or tasks) over time. By observing the rate at which work is being completed, the team and project manager can project when all remaining work will reach zero - predicting the project or sprint completion date. It does not measure risk (A), create a backlog (C), or serve as a project charter (D). Its primary value is velocity-based forecasting of when work will be done.
Topics
Community Discussion
No community discussion yet for this question.