
PMI-SP · Question #302
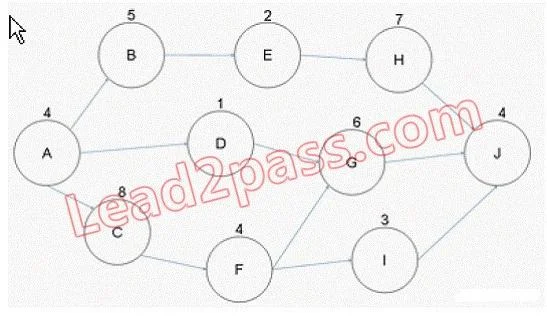
Examine the figure given below. In this project network diagram, what is the total float for Activity I?
The correct answer is A. Three. The float for Activity I is three days. The early start for Activity I is Day 17 and the late start for Activity I is Day 20. Therefore, the difference of the early start and the late start reveals the float as three days. It is possible, and acceptable, to use the difference…
Question
Examine the figure given below. In this project network diagram, what is the total float for Activity I?
Exhibit
Options
- AThree
- BZero
- CFive
- DOne
How the community answered
(49 responses)- A67% (33)
- B10% (5)
- C4% (2)
- D18% (9)
Explanation
The float for Activity I is three days. The early start for Activity I is Day 17 and the late start for Activity I is Day 20. Therefore, the difference of the early start and the late start reveals the float as three days. It is possible, and acceptable, to use the difference of the early finish and the late finish to find the float, as the value will be the same amount. Answer options B, D, and C are incorrect. These are not the valid calculation for the total float.
Topics
Community Discussion
No community discussion yet for this question.