
PMI-ACP · Question #529
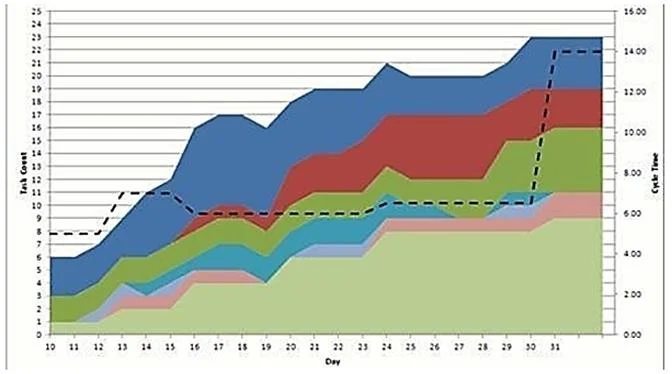
The following is a picture of which of the following Information Radiators?
The correct answer is C. Cumulative Flow Diagram. A Cumulative Flow Diagram (CFD) is an area chart that shows the quantity of work in each stage of the workflow over time. Each colored band represents a stage (e.g., Backlog, In Progress, Done), and the width of each band at any point indicates the amount of WIP in that stage…
Question
The following is a picture of which of the following Information Radiators?
Exhibit
Options
- ABurndown Chart
- BKanban Tracking System
- CCumulative Flow Diagram
- DBurnup Chart
How the community answered
(26 responses)- A4% (1)
- C92% (24)
- D4% (1)
Explanation
A Cumulative Flow Diagram (CFD) is an area chart that shows the quantity of work in each stage of the workflow over time. Each colored band represents a stage (e.g., Backlog, In Progress, Done), and the width of each band at any point indicates the amount of WIP in that stage. It is used to identify bottlenecks, measure flow stability, and track throughput and cycle time trends - distinguishing it from a Burndown (which tracks remaining work) or a Burnup chart (which tracks completed work).
Topics
Community Discussion
No community discussion yet for this question.