
CompTIA
PK0-005 · Question #524
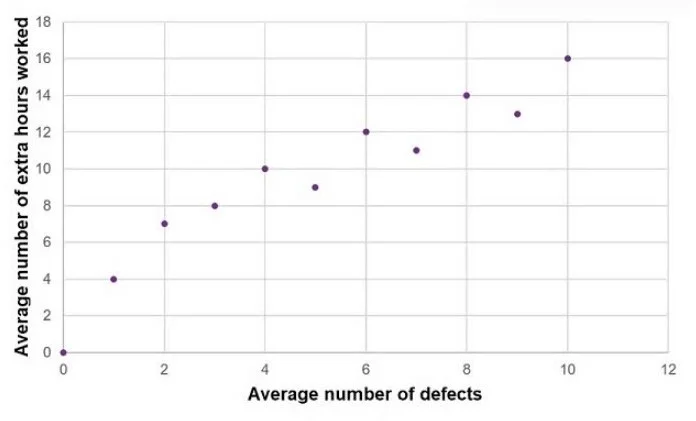
Given the following chart: Which of the following best describes the results?
Sign in or unlock PK0-005 to reveal the answer and full explanation for question #524. The question stem and answer options stay visible for context.
Project Management Concepts
Question
Given the following chart:
Which of the following best describes the results?
Exhibit
Options
- ANo correlation exists between the extra hours worked and the number of defects in the code.
- BA positive correlation exists between the extra hours worked and the number of defects in the
- CA non-linear correlation exists between the extra hours worked and the number of defects in the
- DA negative correlation exists between the extra hours worked and the number of defects in the
Unlock PK0-005 to see the answer
You've previewed enough free PK0-005 questions. Unlock PK0-005 for full answers, explanations, the timed quiz mode, progress tracking, and the master PDF. Question stem and options stay visible so you can still see what's on the exam.
Topics
#Correlation#Data analysis#Quality management#Project metrics