
PK0-004 · Question #213
Which of the following is used to perform a root cause analysis?
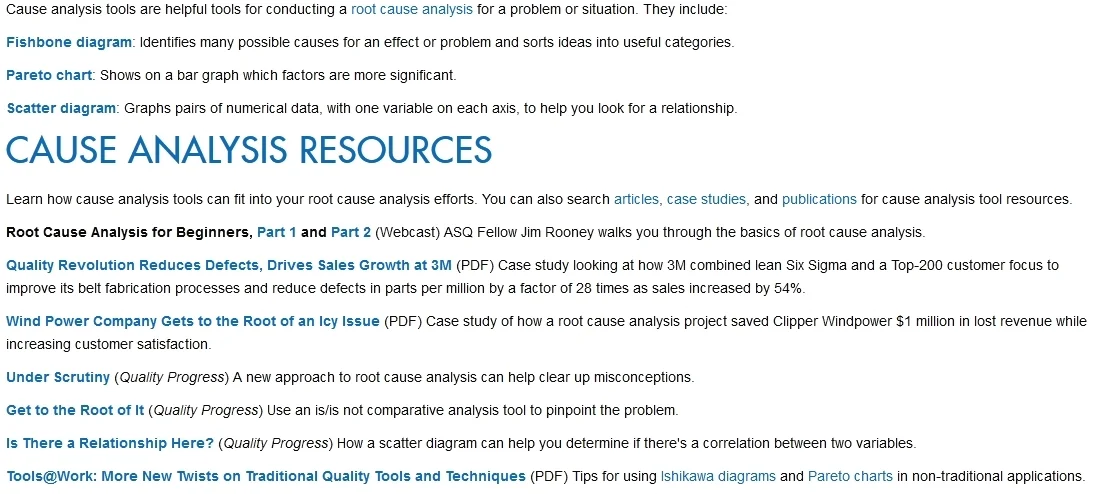
The correct answer is A. Ishikawa diagram. The Ishikawa diagram is the standard tool for root cause analysis, mapping potential causes across categories to a central problem or effect.
Question
Which of the following is used to perform a root cause analysis?
Exhibit
Options
- AIshikawa diagram
- BBar chart
- CPareto diagram
- DScatter plot
How the community answered
(39 responses)- A87% (34)
- B8% (3)
- C3% (1)
- D3% (1)
Why each option
The Ishikawa diagram is the standard tool for root cause analysis, mapping potential causes across categories to a central problem or effect.
The Ishikawa diagram, also called a fishbone or cause-and-effect diagram, is specifically designed to identify and organize the root causes of a problem by branching potential contributing factors into categories such as people, process, and environment. It visually maps the relationship between causes and a central effect, making it the primary tool for structured root cause analysis. Its categorical structure helps teams systematically explore all possible causes rather than focusing only on surface-level symptoms.
A bar chart displays and compares categorical data quantities and is not designed to analyze causal relationships or root causes.
A Pareto diagram applies the 80/20 rule to identify which problems occur most frequently, showing what to prioritize rather than explaining why problems occur.
A scatter plot reveals correlation between two numerical variables but does not establish or map cause-and-effect relationships.
Concept tested: Root cause analysis using Ishikawa fishbone diagram
Source: https://asq.org/quality-resources/fishbone
Topics
Community Discussion
No community discussion yet for this question.