
MB-500 · Question #350
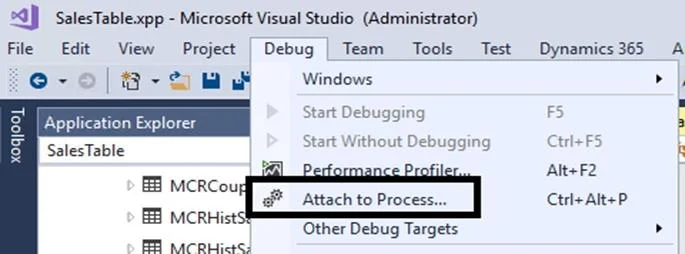
A company uses Dynamics 365 Finance. Developers receive an error in an existing solution. The solution must be debugged to identify the root cause of the error. You need to enable debugging in…
The correct answer is A. Press F5. D. Using Visual Studio to debug, attach the debugger to the IIS process. E. Using Visual Studio to debug, attach the debugger to the X++ compiler process. A: Set a hit count condition If you suspect that a loop in your code starts misbehaving after a certain number of iterations, you can set a breakpoint to stop execution after that number of hits, rather than having to repeatedly press F5 to reach that iteration. E: X++ is used…
Question
Exhibit
Options
- APress F5.
- BUsing Visual Studio to debug, attach the debugger to the devenv.exe process.
- CUsing Visual Studio to debug, start debugging with your start-up object.
- DUsing Visual Studio to debug, attach the debugger to the IIS process.
- EUsing Visual Studio to debug, attach the debugger to the X++ compiler process.
How the community answered
(24 responses)- A92% (22)
- B4% (1)
- C4% (1)
Explanation
A: Set a hit count condition If you suspect that a loop in your code starts misbehaving after a certain number of iterations, you can set a breakpoint to stop execution after that number of hits, rather than having to repeatedly press F5 to reach that iteration. E: X++ is used in Dynamics 365 Finance D: Use Visual Studio To Debug D365 Attach To Process Attach to process. To debug D365 we need to attach to the existing process that is already running on the machine. To do this, go to Debug>Attach to Process. Select the process. In the dialog that opens up, select Show processes from all users. Then select either 'w3wp.exe' or 'iisexpress.exe'. Note: Microsoft Dynamics 365 for Finance and Operations runs as a website, hosted in IIS (Internet Information Services). https://learn.microsoft.com/en-us/visualstudio/debugger/using-breakpoint
Topics
Community Discussion
No community discussion yet for this question.