
RCDD · Question #163
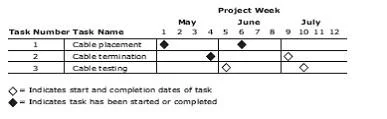
The figure below represents what type of chart?
The correct answer is A. Milestone. A milestone chart marks significant project events as discrete points on a timeline without showing task duration or dependency relationships.
Question
The figure below represents what type of chart?
Exhibit
Options
- AMilestone
- BPERT
- CGantt
- DCalendar
- EStatus
How the community answered
(58 responses)- A84% (49)
- B7% (4)
- C2% (1)
- D5% (3)
- E2% (1)
Why each option
A milestone chart marks significant project events as discrete points on a timeline without showing task duration or dependency relationships.
A milestone chart represents key project achievements - such as phase completions or major deliverables - as single point-in-time markers on a timeline. Unlike Gantt or PERT charts, it does not display task duration bars or network dependencies, making it suitable for high-level status communication to stakeholders.
A PERT chart is a network diagram showing task interdependencies and critical path calculations, not a simple timeline of discrete event markers.
A Gantt chart displays tasks as horizontal duration bars spanning start-to-finish dates, not as single point-in-time event markers.
A calendar chart presents scheduling information in a traditional month-grid calendar format, not as a project event timeline.
A status chart tracks ongoing health metrics or percentage-complete indicators across project areas, not discrete point-in-time project milestones.
Concept tested: Project milestone chart identification
Source: https://www.pmi.org/learning/library/milestone-schedule-project-planning-7040
Topics
Community Discussion
No community discussion yet for this question.