
PK0-005 · Question #199
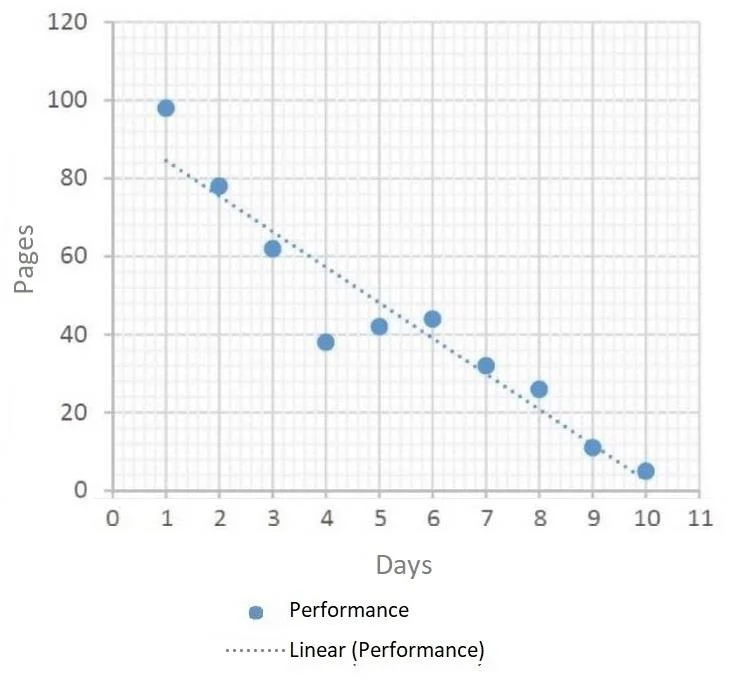
A project team member wrote a user guide over the past ten days. Given the following scatter diagram. Which of the following can be formally concluded?
The correct answer is C. There is a negative correlation with 6me and output. A scatter diagram is a statistical tool used to show the relationship (correlation) between two variables. If the data points on the diagram trend downward as time increases, this indicates a negative correlation between time and output - as time progresses, output decreases. A…
Question
A project team member wrote a user guide over the past ten days. Given the following scatter diagram. Which of the following can be formally concluded?
Exhibit
Options
- AThe team member prioritized other tasks over the completion of this task
- BThe learn member had performance issues over time.
- CThere is a negative correlation with 6me and output
- DThis is a display of units of outstanding work to predict completion
How the community answered
(49 responses)- A8% (4)
- B2% (1)
- C86% (42)
- D4% (2)
Explanation
A scatter diagram is a statistical tool used to show the relationship (correlation) between two variables. If the data points on the diagram trend downward as time increases, this indicates a negative correlation between time and output - as time progresses, output decreases. A scatter diagram can only formally conclude correlation, not causes like prioritization issues or performance problems, which would require further investigation.
Topics
Community Discussion
No community discussion yet for this question.