
MB-500 · Question #88
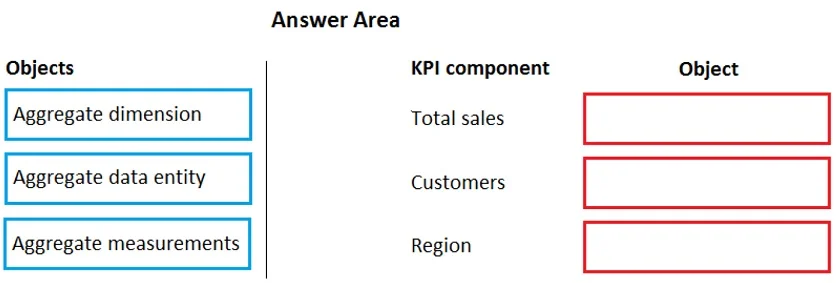
Drag and Drop Question You are a Dynamics 365 Finance developer. The sales department manager must to be able to view total customers by region and total sales by regions. You need to build key…
The correct answer is Aggregate measurements; Aggregate dimension; Aggregate dimension. Dynamics 365 Finance - KPI Modeling Question Explained The Scenario You need two KPIs on a workspace tile: Total customers by region Total sales by region In D365 Finance, KPIs displayed on workspace tiles are built using the Aggregate Framework in the Application Object Tree…
Question
Exhibit
Answer Area
Drag items
Correct arrangement
- Aggregate measurements
- Aggregate dimension
- Aggregate dimension
Explanation
Dynamics 365 Finance - KPI Modeling Question Explained
The Scenario
You need two KPIs on a workspace tile:
- Total customers by region
- Total sales by region
In D365 Finance, KPIs displayed on workspace tiles are built using the Aggregate Framework in the Application Object Tree (AOT).
The Three KPI Components and Why Each Object Goes There
Position 1 → Aggregate measurements
An Aggregate measurement is the top-level container - it defines the star schema (measures + dimensions) that powers the KPI tile. It holds the numeric facts you want to display: COUNT of customers and SUM of sales. This must come first because dimensions attach to it. Without an aggregate measurement, there is nothing to measure.
Position 2 → Aggregate dimension
The "by region" slice for total customers by region. An Aggregate dimension defines the axis along which you group or filter a measure. Here, "region" is the dimension. It links to the customer region reference data and tells the KPI how to segment the customer count.
Position 3 → Aggregate dimension
The "by region" slice for total sales by region. The same concept applies - "region" is again the grouping dimension, this time for the sales measure. Each KPI that slices data requires its own dimension reference, hence the second Aggregate dimension.
Why Aggregate data entity Is Not Used Here
An Aggregate data entity exposes aggregated data for external consumption (e.g., OData, integrations). It is not the correct building block for workspace tile KPIs. This is the most common distractor/mistake - confusing it with aggregate measurements, which are the actual KPI model objects.
Summary Table
| Position | Object | Role |
|---|---|---|
| 1 | Aggregate measurements | The KPI container holding measures (count, sum) |
| 2 | Aggregate dimension | "By region" grouping for total customers |
| 3 | Aggregate dimension | "By region" grouping for total sales |
The key insight: one aggregate measurement can contain multiple measures, but each "by region" breakdown requires a dimension - and both KPIs share the same dimension type (region), which is why Aggregate dimension appears twice.
Topics
Community Discussion
No community discussion yet for this question.