nerdexam
Microsoft

MB-230 · Question #264

Case Study 4 - Lamna Healthcare Background Lamna Healthcare Company has a call center for the city. They receive roughly 5,000 calls a day on health issues. They have the following three departments…

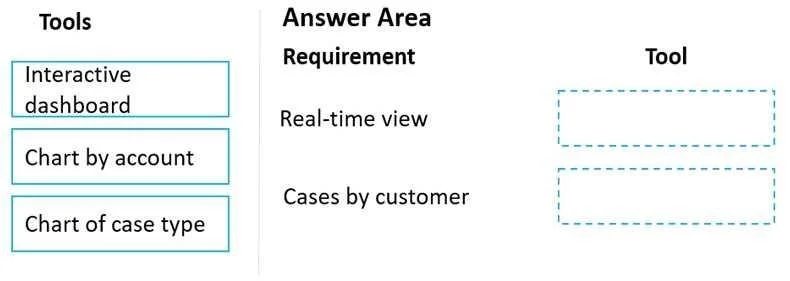
The correct answer is Interactive dashboard; Chart by account. Explanation: Visualization Tools for Lamna Healthcare The two visualization requirements map to two specific tools. Here's the breakdown: --- Requirement 1 → Interactive Dashboard > "Support representatives must have a real-time view of cases assigned to them, including the…

manage analytics, visualizations, and insights

Question

Case Study 4 - Lamna Healthcare Background Lamna Healthcare Company has a call center for the city. They receive roughly 5,000 calls a day on health issues. They have the following three departments that take calls daily: - Chronic illnesses - Flu-type illnesses - Geriatric illnesses There is a fourth area that monitors for miscellaneous issues. They are implementing Dynamics 365 Customer Service. Requirements. Queues A queue has to be set up for each department. Emails must automatically be routed to the appropriate queue. Miscellaneous queues must be visible to everyone. The other queues must be visible only to the appropriate department. If a case is open more than 30 days, the case must automatically be routed to the supervisor. There must be a button on the queue list screen to route a case to a supervisor if requested. Requirements. Visualizations Support representatives must have a real-time view of cases assigned to them, including the status of each case. Support representatives must be able to see a graphic view of cases by customer that are assigned to them. Requirements. Knowledge Base Support representatives must use the knowledge base first to try to solve issues. Support representatives must be able to reference the knowledge base when it is used to resolve the case. The knowledge base article that is used to resolve a case must always be sent to the customer. If the answer is not in the knowledge base, a support representative needs to create a knowledge base article. Requirements. Cases The cases must follow a process that includes identify, research, and resolve. A confirmation section must be added before the resolve section. Customers must have contracts that allow them to call Lamna Healthcare 10 times a year for help. In addition to the 10 free calls, customers must be able to send 15 emails a year for support. Cases that come in as phone calls must be resolved with seven business days. Cases that come in as emails must be resolved within three business days. Requirements. Surveys Lamna Healthcare sends out about 100,000 surveys a month. Lamna must use Microsoft Forms Pro for their surveys. All surveys must have the company logo. The logo's company colors must not be changed. Any modifications to the graphic or colors is a breach of company policies. A survey must automatically be sent once a case is resolved. A manual survey must be sent if a case is escalated. A survey must not be sent without confirming that it is accurate. Supervisors must test a survey before it is finalized. Drag and Drop Question You need to choose which tools need to be created and configured to meet the following requirements. Which tools should you configure? To answer, drag the appropriate tools to the correct requirements. Each tool may be used once, more than once, or not at all. You may need to drag the split bar between panes or scroll to view content. NOTE: Each correct selection is worth one point. Answer:

Exhibit

MB-230 question #264 exhibit

Answer Area

Drag items

Interactive dashboardChart by accountChart of case type

Correct arrangement

  • Interactive dashboard
  • Chart by account

Explanation

Explanation: Visualization Tools for Lamna Healthcare

The two visualization requirements map to two specific tools. Here's the breakdown:


Requirement 1 → Interactive Dashboard

"Support representatives must have a real-time view of cases assigned to them, including the status of each case."

Why Interactive Dashboard? In Dynamics 365 Customer Service, Interactive Dashboards are specifically designed for real-time monitoring. They update without page refreshes, support filtering by owner (so reps see only their cases), and display multiple data streams simultaneously - including case status. This is the only dashboard type in D365 built for this "live queue" scenario.

Common Mistake: Confusing this with a standard dashboard. Standard dashboards don't update in real-time and lack the interactive filtering needed for individual rep views.


Requirement 2 → Chart by Account

"Support representatives must be able to see a graphic view of cases by customer assigned to them."

Why Chart by Account? In Dynamics 365, "Account" is the entity that represents a customer/organization. A "Chart by Account" groups and visualizes cases at the customer level - exactly what "by customer" means. This gives reps a graphical breakdown of how many/which cases belong to each customer they're handling.

Why NOT "Chart of Case Type"? Case type categorizes cases by category (e.g., chronic illness, flu) - not by customer. It answers "what kind of cases do I have?" not "which customers do I have cases for?" - so it doesn't satisfy this requirement.


Summary Table

RequirementToolKey Reason
Real-time view of cases + statusInteractive DashboardLive updates, filterable by owner
Graphic view of cases by customerChart by AccountAccount = Customer in D365
(not used)Chart of Case TypeGroups by category, not customer

Topics

#interactive dashboard#chart by account#case visualization#real-time view

Community Discussion

No community discussion yet for this question.

Full MB-230 Practice