MB-230 · Question #17
Drag and Drop Question You are customizing a Dynamics 365 for Customer Service implementation. The call center manager requires a visual representation that includes the number of resolved cases by mo
Dynamics 365 Customer Service: Creating a System Chart The Core Distinction The key requirement is "visible to all users" - this means you need a system chart, not a personal chart. This distinction drives the entire sequence. --- Correct Three-Step Sequence Step 1 - Option 5: Na
Question
Drag and Drop Question You are customizing a Dynamics 365 for Customer Service implementation. The call center manager requires a visual representation that includes the number of resolved cases by month for each call center agent. The chart must be visible to all users within the service area. You need to create the chart. Which three actions should you perform in sequence? To answer, move the appropriate actions from the list of actions to the answer area and arrange them in the correct order. Answer:
Exhibit
Options
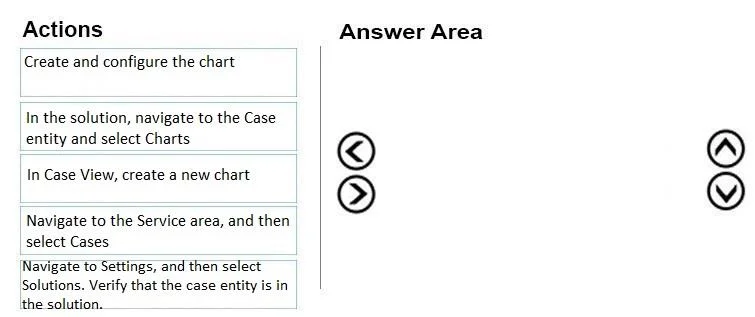
- Option1Create and configure the chart
- Option2In the solution, navigate to the Case entity and select Charts
- Option3In Case View, create a new chart
- Option4Navigate to the Service area, and then select Cases
- Option5Navigate to Settings, and then select Solutions. Verify that the case entity is in the solution.
Explanation
Dynamics 365 Customer Service: Creating a System Chart
The Core Distinction
The key requirement is "visible to all users" - this means you need a system chart, not a personal chart. This distinction drives the entire sequence.
Correct Three-Step Sequence
Step 1 - Option 5: Navigate to Settings → Solutions. Verify that the Case entity is in the solution.
You must start here because system charts are deployed through the solution framework. If the Case entity isn't in your solution, you cannot add a system chart to it. This is the prerequisite check before any configuration work begins.
Step 2 - Option 2: In the solution, navigate to the Case entity and select Charts.
Once inside the solution, you drill into the Case entity's Charts component. This is where system charts live - scoped to the entity and published to all users in that organization.
Step 3 - Option 1: Create and configure the chart.
Now you build the actual chart - selecting the series (resolved cases), grouping by month, and stacking/grouping by agent to get the visual the manager needs.
Why Options 3 & 4 Are Wrong (Common Mistake)
- Option 4 (Navigate to Service area → Cases) and Option 3 (In Case View, create a new chart) describe how to create a personal chart.
- Personal charts are only visible to the user who created them - directly contradicting the requirement.
- Candidates often choose this path because it's the more familiar UI workflow, but it produces the wrong scope.
Summary Rule
| Goal | Path |
|---|---|
| Chart for you only | Service area → Cases → New Chart |
| Chart for all users | Settings → Solutions → Case Entity → Charts |
Topics
Community Discussion
No community discussion yet for this question.
