
Microsoft
AZ-400 · Question #328
You are configuring project metrics for dashboards in Azure DevOps. You need to configure a chart widget that measures the elapsed time to complete work items once they become active. Which of the…
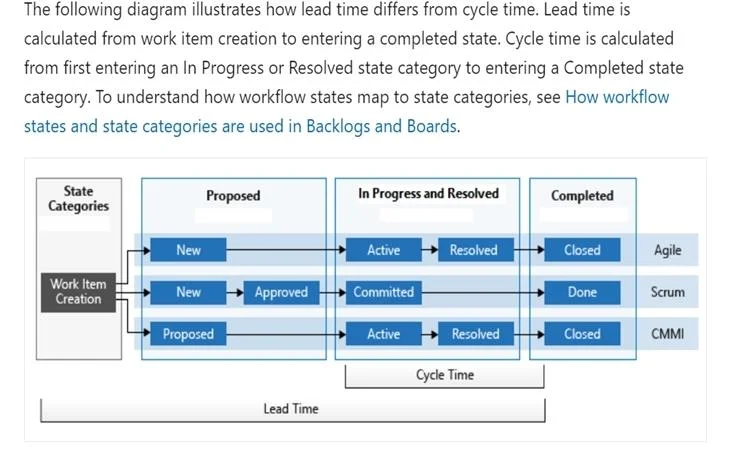
The correct answer is C. Cycle time. Cycle time measures the time it takes for your team to complete work items once they begin actively working on them. https://docs.microsoft.com/en-us/azure/devops/report/dashboards/cycle-time-and-lead-
Submitted by kev92· Mar 6, 2026Implement an instrumentation strategy
Question
You are configuring project metrics for dashboards in Azure DevOps. You need to configure a chart widget that measures the elapsed time to complete work items once they become active. Which of the following is the widget you should use?
Exhibit
Options
- ACumulative Flow Diagram
- BBurnup
- CCycle time
- DBurndown
How the community answered
(49 responses)- A2% (1)
- B4% (2)
- C86% (42)
- D8% (4)
Explanation
Cycle time measures the time it takes for your team to complete work items once they begin actively working on them. https://docs.microsoft.com/en-us/azure/devops/report/dashboards/cycle-time-and-lead-
Community Discussion
No community discussion yet for this question.