Microsoft
70-778 · Question #77
70-778 Question #77: Real Exam Question with Answer & Explanation
Sign in or unlock 70-778 to reveal the answer and full explanation for question #77. The question stem and answer options stay visible for context.
Question
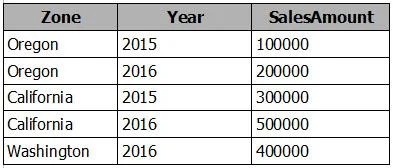
You have a table named Sales that contains sales data for the United States. A sample of the data in Sales is shown in the following table. When you attempt to create a map that shows SalesAmount by Zone, you discover that the map shows a bubble based on cities instead of states. You need to ensure that the map shows bubbles based on states. What should you do?
Exhibit
Options
- AAdd a column named Country that contains United States as the value.
- BAdd a column for longitude and a column for latitude.
- CSelect the Zone field. From the Modeling tab, change the Data Category.
- DSelect the Zone field. From the Modeling tab, change the Data Type.
Unlock 70-778 to see the answer
You've previewed enough free 70-778 questions. Unlock 70-778 for full answers, explanations, the timed quiz mode, progress tracking, and the master PDF. Question stem and options stay visible so you can still see what's on the exam.