Microsoft
70-778 · Question #126
70-778 Question #126: Real Exam Question with Answer & Explanation
Sign in or unlock 70-778 to reveal the answer and full explanation for question #126. The question stem and answer options stay visible for context.
Question
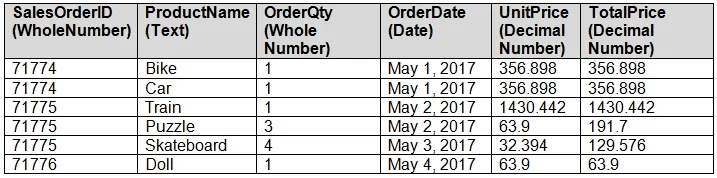
You have a table named Sales. A sample of the data in Sales is shown in the following table. You create a stacked column chart visualization that displays ProductName by Date. You discover that the axis for the visualization displays all the individual dates. You need to ensure that the visualization displays ProductName by year and that you can drill down to see ProductName by week and day. What should you do first?
Exhibit
Options
- ACreate a new table that has columns for the date, year, week, and day.
- BCreate a new hierarchy in the Sales table.
- CFormat the visualization and set the type of the X-Axis to Categorical.
- DConfigure a visual filter for the Date column that uses an advanced filter.
Unlock 70-778 to see the answer
You've previewed enough free 70-778 questions. Unlock 70-778 for full answers, explanations, the timed quiz mode, progress tracking, and the master PDF. Question stem and options stay visible so you can still see what's on the exam.