
Microsoft
70-778 · Question #80
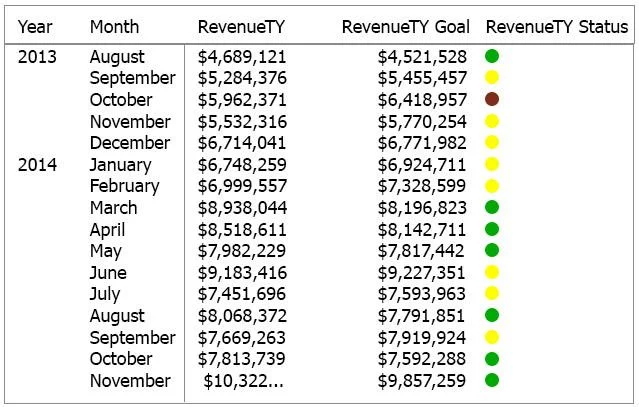
You have a Power Pivot model that includes a KPI. You need to create a visualization based on the Power Pivot model as shown in the exhibit. Which type of visualization should you use?
The correct answer is D. table. KPI visual cannot list multiple rows. Only way to achive that is by creating a calculated column to return an image URL, and then adding that to a table.
Model and Visualize Data by Using Power BI Desktop
Question
You have a Power Pivot model that includes a KPI. You need to create a visualization based on the Power Pivot model as shown in the exhibit. Which type of visualization should you use?
Exhibit
Options
- Amatrix
- BKPI
- Cmulti row card
- Dtable
How the community answered
(51 responses)- A12% (6)
- B4% (2)
- C8% (4)
- D76% (39)
Explanation
KPI visual cannot list multiple rows. Only way to achive that is by creating a calculated column to return an image URL, and then adding that to a table.
Topics
#KPI visualization#Power Pivot#table visual#visualization types
Community Discussion
No community discussion yet for this question.