
Microsoft
70-778 · Question #146
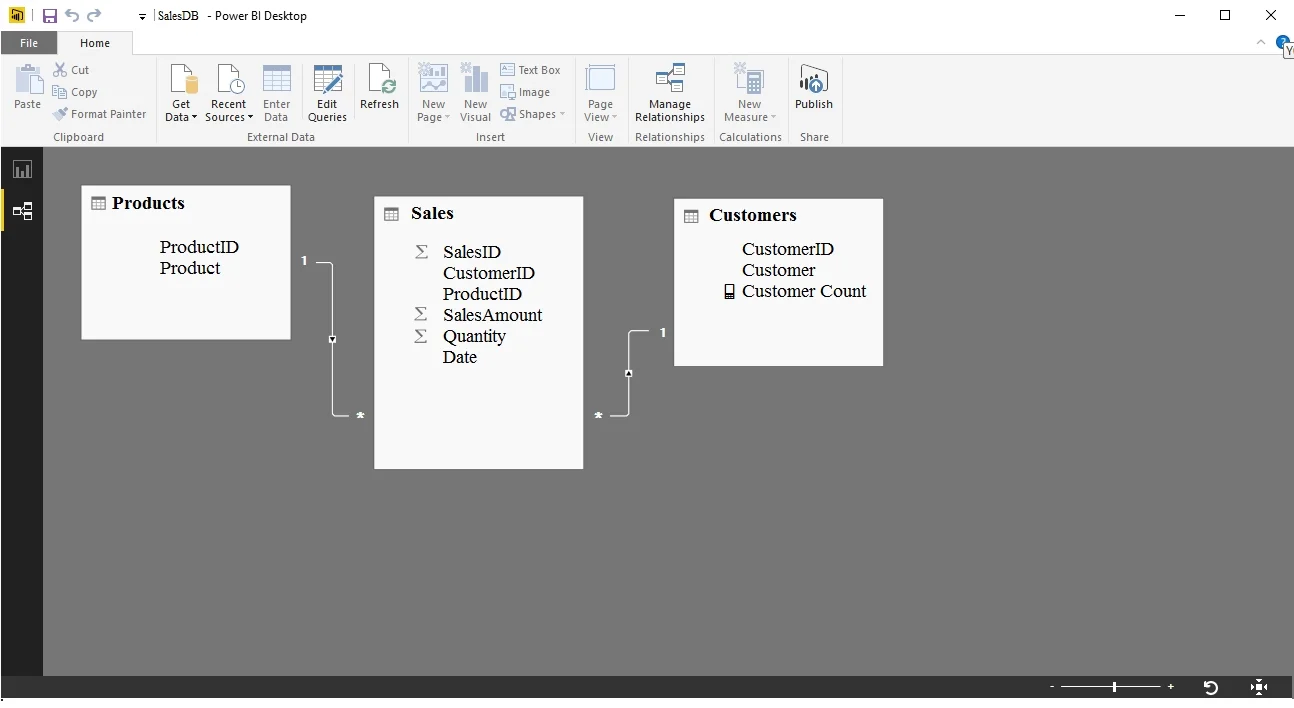
You have a Power BI Desktop project that has the model shown in the exhibit. (Click the Exhibit tab.) Customer Count is a measure that uses the CountRows function to calculate the number of…
The correct answer is D. Modify the table relationship between the Products table and the Sales table to use a Cross filter. https://docs.microsoft.com/en-us/power-bi/desktop-create-and-manage-relationships
Model and Visualize Data by Using Power BI Desktop
Question
You have a Power BI Desktop project that has the model shown in the exhibit. (Click the Exhibit tab.) Customer Count is a measure that uses the CountRows function to calculate the number of customers. You create a table visualization that displays ProductID, Product, and Customer Count. When you view the table, you discover that Customer Count always displays the total number of customers instead of the number of customers who purchased the product. You need to ensure that the table visualization displays the number of customers who purchased each product. What should you do?
Exhibit
Options
- AModify the table relationship between the Customers table and the Sales table to use a Cross filter
- BModify the Customer Count measure to use the COUNT function.
- CModify the Customer Count measure to use the COUNTX function.
- DModify the table relationship between the Products table and the Sales table to use a Cross filter
How the community answered
(44 responses)- A16% (7)
- B5% (2)
- C7% (3)
- D73% (32)
Explanation
https://docs.microsoft.com/en-us/power-bi/desktop-create-and-manage-relationships
Topics
#cross-filter direction#DAX measures#table relationships#data model
Community Discussion
No community discussion yet for this question.