
PMI-ACP · Question #762
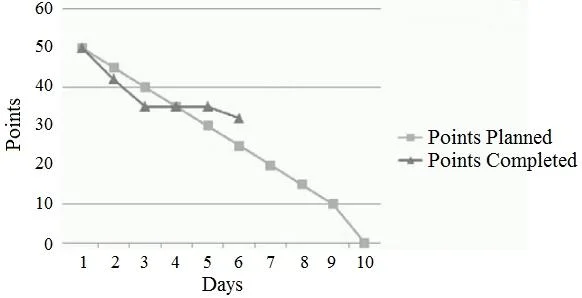
Based on the chart, what is the current status of the iteration when comparing story points planned versus completed?
The correct answer is D. Estimate items in the product backlog. Tracking story points planned versus completed over iterations measures the team's velocity-the rate at which the team delivers value. Velocity data is primarily used to estimate how many items from the product backlog can be delivered in future iterations. Option A (estimate…
Question
Based on the chart, what is the current status of the iteration when comparing story points planned versus completed?
Exhibit
Options
- AEstimate the project team's capacity.
- BDetermine how much work can be delivered.
- CCalculate how much work will fit into the next iteration.
- DEstimate items in the product backlog.
How the community answered
(18 responses)- A6% (1)
- B6% (1)
- C11% (2)
- D78% (14)
Explanation
Tracking story points planned versus completed over iterations measures the team's velocity-the rate at which the team delivers value. Velocity data is primarily used to estimate how many items from the product backlog can be delivered in future iterations. Option A (estimate team capacity) is an input to planning, not an output of the velocity chart. Option B (determine how much work can be delivered) is close but too general-velocity specifically calibrates backlog sizing and forecasting. Option C (how much fits in the next iteration) is a planning use of velocity, but it is subordinate to Option D because you must first estimate backlog items to know what fits. Velocity from planned vs. completed story points is the foundational metric for product backlog estimation and release forecasting.
Topics
Community Discussion
No community discussion yet for this question.