PL-300 · Question #122
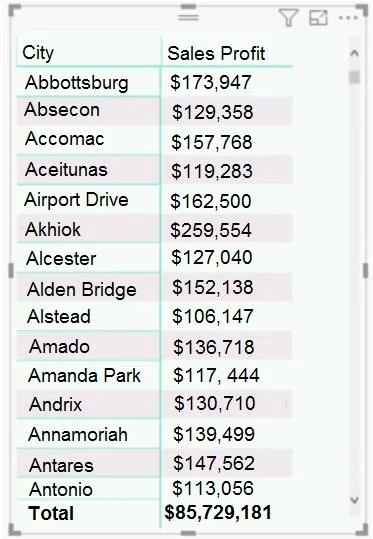
You have the dataset shown in the following exhibit. You need to ensure that the visual shows only the 10 cities that have the highest sales profit. What should you do?
The correct answer is A. Add a Top N filter to the visual.. Power BI's built-in Top N filter (available in the Filters pane for any visual) lets you filter a visual to show only the top or bottom N items ranked by a measure - in this case, the top 10 cities by Sales Profit. This is the simplest, most direct, and maintenance-free solution.
Question
You have the dataset shown in the following exhibit. You need to ensure that the visual shows only the 10 cities that have the highest sales profit. What should you do?
Exhibit
Options
- AAdd a Top N filter to the visual.
- BConfigure the Sales Profit measure to use the RANKX function.
- CAdd a calculated column to the table that uses the TOPN function. In the visual, replace Sales
- DAdd a calculated column to the table that returns the city name if the city is in the top 10,
How the community answered
(19 responses)- A79% (15)
- B5% (1)
- C5% (1)
- D11% (2)
Explanation
Power BI's built-in Top N filter (available in the Filters pane for any visual) lets you filter a visual to show only the top or bottom N items ranked by a measure - in this case, the top 10 cities by Sales Profit. This is the simplest, most direct, and maintenance-free solution. Option B (RANKX measure) would rank cities but would not automatically limit the visual to 10 rows without additional filtering steps. Option C misuses TOPN, which is a DAX table function meant for table expressions, not calculated columns. Option D (a calculated column returning city name or blank) adds unnecessary model complexity. The Top N visual-level filter is the purpose-built feature for this exact scenario.
Topics
Community Discussion
No community discussion yet for this question.