
NCA-5.15 · Question #91
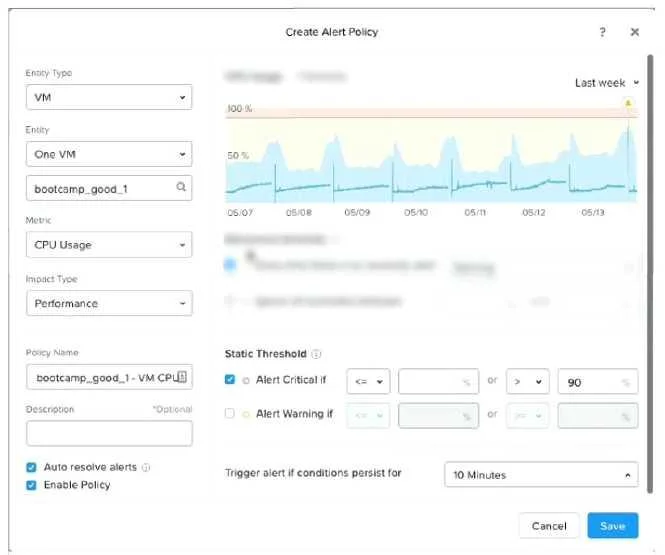
Refer to the exhibit. What is indicated by the yellow area of the chart?
The correct answer is C. Warning alerts. In Nutanix Prism monitoring dashboards, color-coded thresholds use yellow to represent warning-level alerts, indicating a condition that requires attention but has not yet reached critical severity.
Question
Refer to the exhibit. What is indicated by the yellow area of the chart?
Exhibit
Options
- ANormal utilization
- BCritical alerts
- CWarning alerts
- DAbnormal utilization
How the community answered
(41 responses)- A5% (2)
- B2% (1)
- C90% (37)
- D2% (1)
Why each option
In Nutanix Prism monitoring dashboards, color-coded thresholds use yellow to represent warning-level alerts, indicating a condition that requires attention but has not yet reached critical severity.
Normal utilization is represented by green in Nutanix Prism's color-coded severity system, not yellow.
Critical alerts are represented by red, indicating conditions that require immediate remediation rather than the yellow warning level.
Nutanix Prism uses a three-tier color convention for alert severity: green for normal, yellow for warning, and red for critical. Yellow warning alerts indicate that a metric has crossed a configurable warning threshold, signaling that an administrator should investigate before the condition escalates to a critical state.
Abnormal utilization is not a defined alert category in Nutanix Prism; the system classifies conditions using warning and critical thresholds, not an abnormal designation.
Concept tested: Nutanix Prism alert severity color coding
Source: https://docs.nutanix.com/en/main/prism-central/topics/pc-alerts-overview.html
Topics
Community Discussion
No community discussion yet for this question.