
DP-300 · Question #364
SIMULATION You need to generate an email alert to [email protected] when CPU percentage utilization for db1 is higher than average. To complete this task, sign in to the virtual machine. You may…
Azure SQL CPU Alert with Dynamic Thresholds - Exam Explanation --- Overall Goal The task creates an Azure Monitor metric alert that emails [email protected] whenever db1's CPU usage rises above its own historical average - rather than a fixed threshold like "alert at 80%." This…
Question
Exhibit
Explanation
Azure SQL CPU Alert with Dynamic Thresholds - Exam Explanation
Overall Goal
The task creates an Azure Monitor metric alert that emails [email protected] whenever db1's CPU usage rises above its own historical average - rather than a fixed threshold like "alert at 80%." This is the correct approach because "higher than average" implies a relative baseline, not an absolute number, which maps directly to Azure Monitor's Dynamic Thresholds feature.
Step-by-Step Reasoning
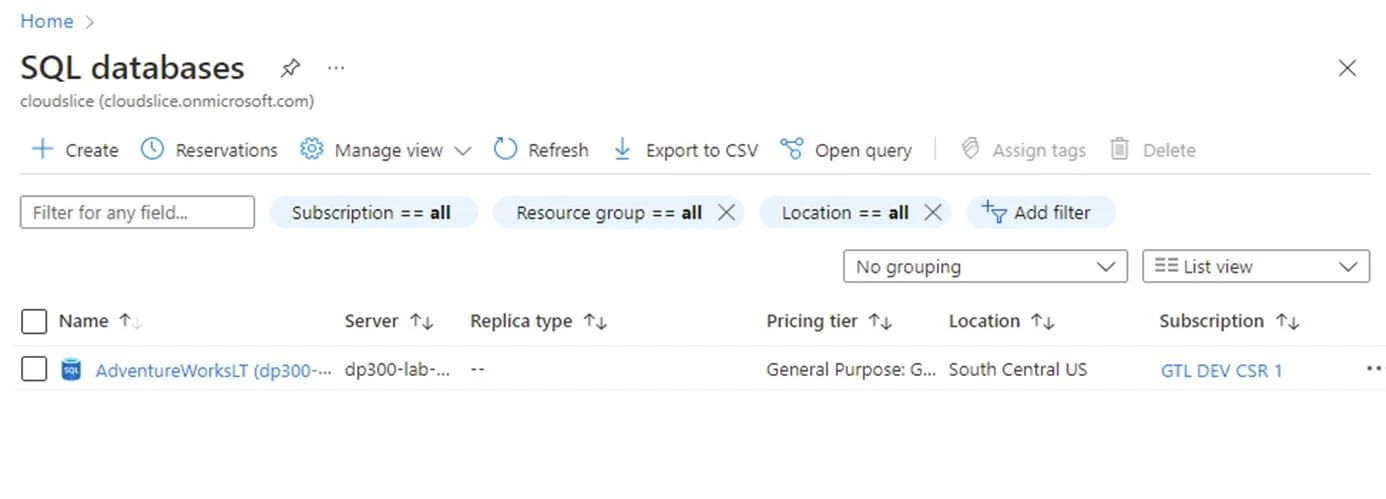
Step 1-2: Navigate to the SQL database (db1) All monitoring for an Azure SQL Database is scoped to the resource itself. You must start from the database blade so the alert is associated with the correct resource. Skipping to Azure Monitor directly is possible but error-prone - you'd have to manually select the resource scope and risk targeting the wrong database or subscription.
Step 3: Open Alerts -> Create alert rule
This initiates the alert wizard scoped to db1. The alert rule ties a signal (metric), a condition (threshold logic), and an action (notification) into one unit. All three must exist in the same rule or the alert fires with no way to notify anyone.
Step 4: Select "CPU percentage" as the signal Azure exposes many metrics (DTU, connections, deadlocks, etc.). Selecting CPU percentage specifically tells the alert engine what to watch. Choosing the wrong signal (e.g., DTU percentage) would monitor a different resource dimension and miss CPU spikes.
Step 5: Select "Dynamic" for the Threshold This is the critical step that satisfies "higher than average." Dynamic thresholds use machine learning to analyze historical CPU patterns (hourly, daily, weekly seasonality) and auto-calculate what "normal" looks like. A Static threshold requires you to type a fixed number - which cannot express "higher than average" since the average changes over time.
Step 6: Operator = "Greater than," Aggregation = "Average"
- Greater than: fires when CPU exceeds the dynamic baseline (not equal to or below).
- Average: the aggregation window computes the mean CPU over the evaluation period before comparing to the threshold. Using "Maximum" instead would alert on momentary spikes; "Minimum" would be nonsensical for this use case.
- No manual threshold value appears - this confirms Dynamic mode is active and the system calculates it automatically.
Skipping "Done" leaves the signal unconfigured and the wizard won't let you proceed to Actions.
Step 7-8: Actions tab -> Create action group An alert rule without an action group fires silently - the condition is evaluated but nothing happens. The action group is the delivery mechanism (email, SMS, webhook, etc.). Creating it inline here is the fastest path; reusing an existing group is valid too, but for this exam scenario you're creating fresh.
Step 9: Name the action group "emailgroup" The name is just an identifier. What matters is that you proceed to Notifications to configure how the group acts. An action group with no notification type defined does nothing.
Step 10: Notification type = Email/SMS -> enter [email protected]
This is the actual delivery configuration. The exam answer specifically requires Email (not SMS or push), and the exact address [email protected] must match. Selecting the wrong notification type or mistyping the address means the alert fires but the admin never receives it.
Step 11: Review + Create Azure validates the full rule (resource scope + signal + condition + action group) before committing. Skipping Review would risk deploying a misconfigured rule silently.
What Goes Wrong If Steps Are Skipped or Reordered
| Skipped Step | Consequence |
|---|---|
| Skipping Dynamic threshold (Step 5) | Alert uses static threshold - can't express "higher than average" |
| Skipping action group (Steps 7-9) | Alert fires but no email is sent |
| Skipping email config (Step 10) | Action group exists but has no notification target |
| Starting from Azure Monitor instead of db1 blade | Must manually scope the resource - higher risk of wrong target |
Memory Tip
Think of the alert as three layers:
WHAT to watch -> WHEN to fire -> WHO to notify
- WHAT: CPU percentage (Step 4)
- WHEN: Dynamic > Average (Steps 5-6)
- WHO: Action group -> Email -> [email protected] (Steps 7-10)
Dynamic thresholds = "let Azure figure out normal for me." If the exam says "higher than average" or "compared to baseline," the answer is always Dynamic, never Static.
Topics
Community Discussion
No community discussion yet for this question.