Microsoft
70-778 · Question #40
70-778 Question #40: Real Exam Question with Answer & Explanation
Sign in or unlock 70-778 to reveal the answer and full explanation for question #40. The question stem and answer options stay visible for context.
Question
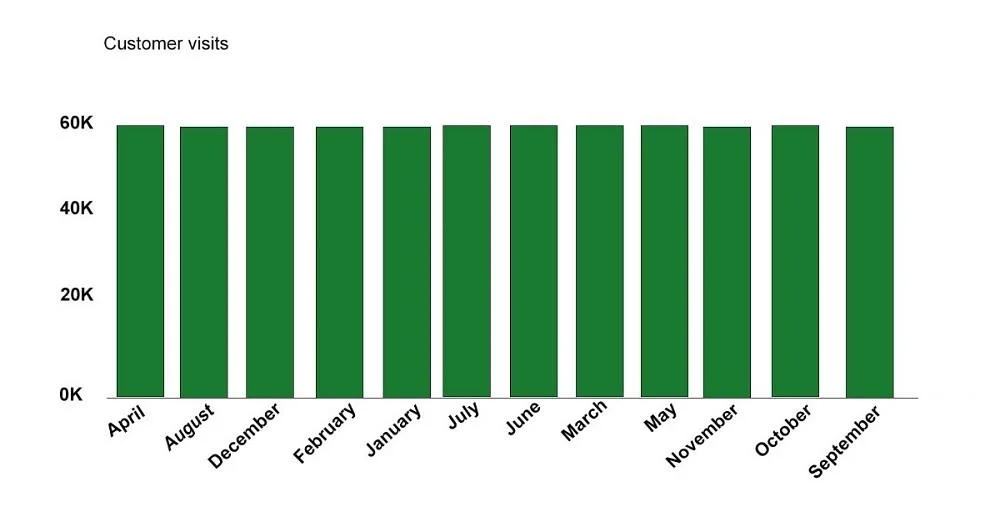
You have two tables named CustomerVisits and Date in a Power BI model. You create a measure to calculate the number of customer visits. You use the measure in the report shown in the exhibit. (Click the Exhibit.) You discover that the total number of customer visits was 60,000, and that there were only 5,000 customer visits in August. You need to fix the report to display the correct data for each month. What should you do?
Exhibit
Options
- ACreate a relationship between the CustomerVisits table and the Date table.
- BCreate a hierarchy in the Date table.
- CModify the n=measure to use the CALCULATE DAX function.
- DModify the measure to use the SUM DAX function.
Unlock 70-778 to see the answer
You've previewed enough free 70-778 questions. Unlock 70-778 for full answers, explanations, the timed quiz mode, progress tracking, and the master PDF. Question stem and options stay visible so you can still see what's on the exam.