Microsoft
70-778 · Question #132
70-778 Question #132: Real Exam Question with Answer & Explanation
Sign in or unlock 70-778 to reveal the answer and full explanation for question #132. The question stem and answer options stay visible for context.
Question
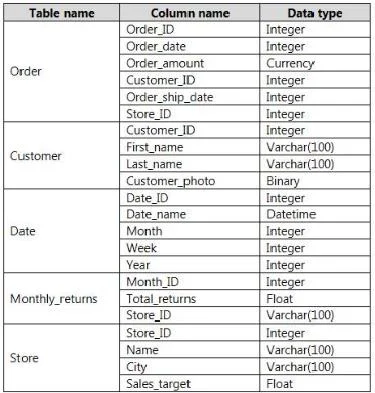
Note: This question is part of a series of questions that use the same scenario. For your convenience, the scenario is repeated in each question. Each question presents a different goal and answer choices, but the text of the scenario is the same in each question in this series. You have a Microsoft SQL Server database that contains the following tables. The following columns contain date information: - Date[Month] in the mmyyyy format - Date[Date_ID] in the ddmmyyyy format - Date[Date_name] in the mm/dd/yyyy format - Monthly_returns[Month_ID] in the mmyyyy format The Order table contains more than one million rows. The Store table has a relationship to the Monthly_returns table on the Store_ID column. This is the only relationship between the tables. You plan to use Power BI Desktop to create an analytics solution for the data. You need to create a chart that displays a sum of Order[Order_amount] by month for the Order_ship_date column and the Order_date column. How should you model the data?
Exhibit
Options
- ACreate a one-to-many relationship from Date[Date_ID] to Order[Order_date] and another
- BAdd a second Date table named Ship_date to the model. Create a many-to-many relationship
- CAdd a second Date table named Ship_date to the model. Create a one-to-many relationship from
- DCreate a one-to-many relationship from Date[Date_ID] to Order[Order_date] and another
Unlock 70-778 to see the answer
You've previewed enough free 70-778 questions. Unlock 70-778 for full answers, explanations, the timed quiz mode, progress tracking, and the master PDF. Question stem and options stay visible so you can still see what's on the exam.