Microsoft
70-778 · Question #129
70-778 Question #129: Real Exam Question with Answer & Explanation
Sign in or unlock 70-778 to reveal the answer and full explanation for question #129. The question stem and answer options stay visible for context.
Question
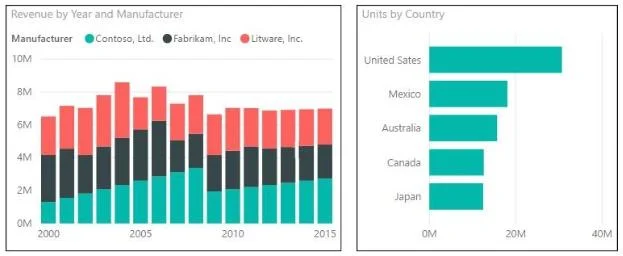
You are creating a report in Power BI Desktop that has two visualizations on a page as shown in the following exhibit. You need to ensure that when you click the bar of a country, only the values for that country are shown on the Revenue by Year and Manufacturer chart.
Exhibit
Options
- AClick the Revenue by Year and Manufacturer chart. On the Format tab, click Edit Interactions. On
- BClick the Revenue by Year and Manufacturer chart. On the Format tab, click Edit Interactions. On
- CClick the Units by Country chart. On the Format tab, click Edit Interactions. On the Revenue by
- DClick the Units by Country chart. On the Format tab, click Edit Interactions. On the Revenue by
Unlock 70-778 to see the answer
You've previewed enough free 70-778 questions. Unlock 70-778 for full answers, explanations, the timed quiz mode, progress tracking, and the master PDF. Question stem and options stay visible so you can still see what's on the exam.