Microsoft
PL-300 · Question #68
You are creating a report in Power BI Desktop that has two visualizations on a page as shown in the following exhibit. You need to ensure that when you click the bar of a country, only the values for
Sign in or unlock PL-300 to reveal the answer and full explanation for question #68. The question stem and answer options stay visible for context.
Submitted by chen.hong· Apr 18, 2026Visualize and analyze the data
Question
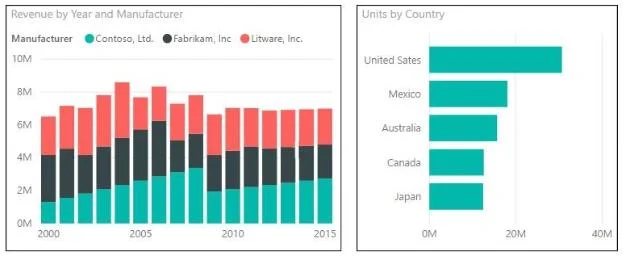
You are creating a report in Power BI Desktop that has two visualizations on a page as shown in the following exhibit. You need to ensure that when you click the bar of a country, only the values for that country are shown on the Revenue by Year and Manufacturer chart.
Exhibit
Options
- AClick the Revenue by Year and Manufacturer chart. On the Format tab, click Edit Interactions. On
- BClick the Revenue by Year and Manufacturer chart. On the Format tab, click Edit Interactions. On
- CClick the Units by Country chart. On the Format tab, click Edit Interactions. On the Revenue by
- DClick the Units by Country chart. On the Format tab, click Edit Interactions. On the Revenue by
Unlock PL-300 to see the answer
You've previewed enough free PL-300 questions. Unlock PL-300 for full answers, explanations, the timed quiz mode, progress tracking, and the master PDF. Question stem and options stay visible so you can still see what's on the exam.
Topics
#Report Interactions#Visual Filtering#Power BI Desktop#Visualizations