Microsoft
PL-300 · Question #491
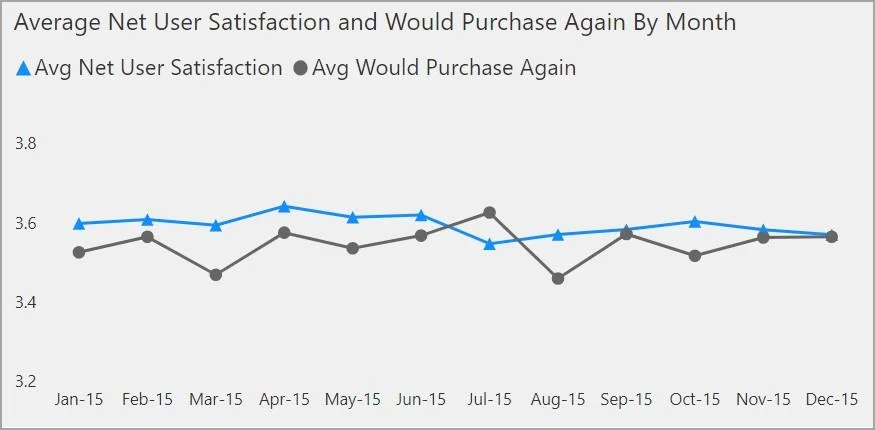
You plan to generate a line chart to visualize and compare the last six months of sales data for two departments. You need to increase the accessibility of the visual. What should you do?
Sign in or unlock PL-300 to reveal the answer and full explanation for question #491. The question stem and answer options stay visible for context.
Submitted by kwame.gh· Apr 18, 2026
Question
You plan to generate a line chart to visualize and compare the last six months of sales data for two departments. You need to increase the accessibility of the visual. What should you do?
Exhibit
Options
- AConfigure a unique marker for each series.
- BConfigure a distinct color for each series.
- CReplace long text with abbreviations and acronyms.
- DMove important information to a tooltip.
Unlock PL-300 to see the answer
You've previewed enough free PL-300 questions. Unlock PL-300 for full answers, explanations, the timed quiz mode, progress tracking, and the master PDF. Question stem and options stay visible so you can still see what's on the exam.