
PL-300 · Question #1
Case Study 1 - Litware, Inc. Overview Litware, Inc. is an online retailer that uses Microsoft Power Bl dashboards and reports. The company plans to leverage data from Microsoft SQL Server databases…
The correct answer is C. Select Column profile, and then select the sales_amount column. Column Profile in Power Query Editor (View > Column Profile) provides a comprehensive statistical summary of a selected column, including value distribution, min, max, average, standard deviation, count of errors, count of empty/null values, and a histogram of value…
Question
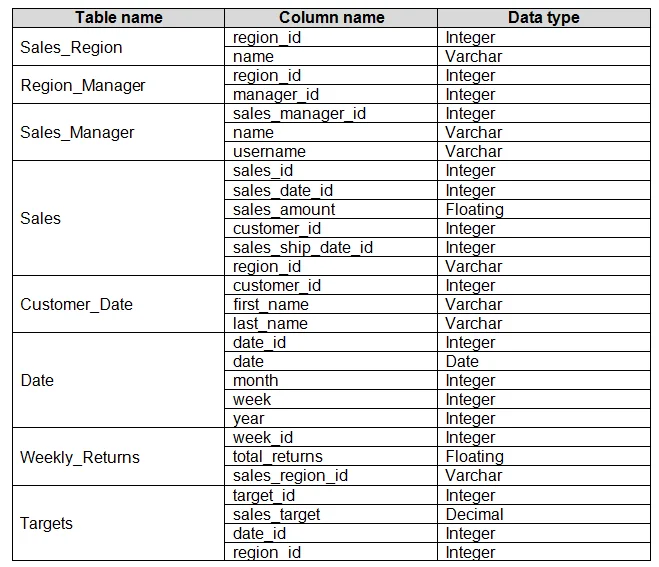
Case Study 1 - Litware, Inc. Overview Litware, Inc. is an online retailer that uses Microsoft Power Bl dashboards and reports. The company plans to leverage data from Microsoft SQL Server databases, Microsoft Excel files, text files, and several other data sources. Litware uses Azure Active Directory (Azure AD) to authenticate users. Existing Environment Sales Data Litware has online sales data that has the SQL schema shown in the following table. In the Date table, the dateid column has a format of yyyymmdd and the month column has a format of yyyymm. The week column in the Date table and the weekid column in the Weekly_Returns table have a format of yyyyww. The regionid column can be managed by only one sales manager. Data Concerns You are concerned with the quality and completeness of the sales data. You plan to verify the sales data for negative sales amounts. Reporting Requirements Litware identifies the following technical requirements:
- Executives require a visual that shows sales by region.
- Regional managers require a visual to analyze weekly sales and
returns.
- Sales managers must be able to see the sales data of their respective
region only.
- The sales managers require a visual to analyze sales performance
versus sales targets.
- The sale department requires reports that contain the number of sales
transactions.
- Users must be able to see the month in reports as shown in the
following example: Feb 2020.
- The customer service department requires a visual that can be
filtered by both sales month and ship month independently.
- The maximum allowed latency to include transactions in reports is
five minutes. You need to address the data concerns before creating the data model. What should you do in Power Query Editor?
Exhibit
Options
- ASelect Column distribution.
- BSelect the sales_amount column and apply a number filter.
- CSelect Column profile, and then select the sales_amount column.
- DTransform the sales_amount column to replace negative values with 0.
How the community answered
(35 responses)- A3% (1)
- B3% (1)
- C94% (33)
Explanation
Column Profile in Power Query Editor (View > Column Profile) provides a comprehensive statistical summary of a selected column, including value distribution, min, max, average, standard deviation, count of errors, count of empty/null values, and a histogram of value frequencies. This is the correct tool for investigating data quality and completeness concerns about a numeric column like sales_amount. Option A (Column Distribution) shows only unique and distinct value counts - useful for categorical columns but insufficient for diagnosing numeric data quality issues. Option B (applying a number filter) filters and removes rows, which alters the dataset rather than helping you inspect it. Option D (replacing negative values with 0) is a remediation step, not a diagnostic one - you should first identify whether negative values exist and how many there are before deciding to transform them.
Topics
Community Discussion
No community discussion yet for this question.