
PL-300 · Question #365
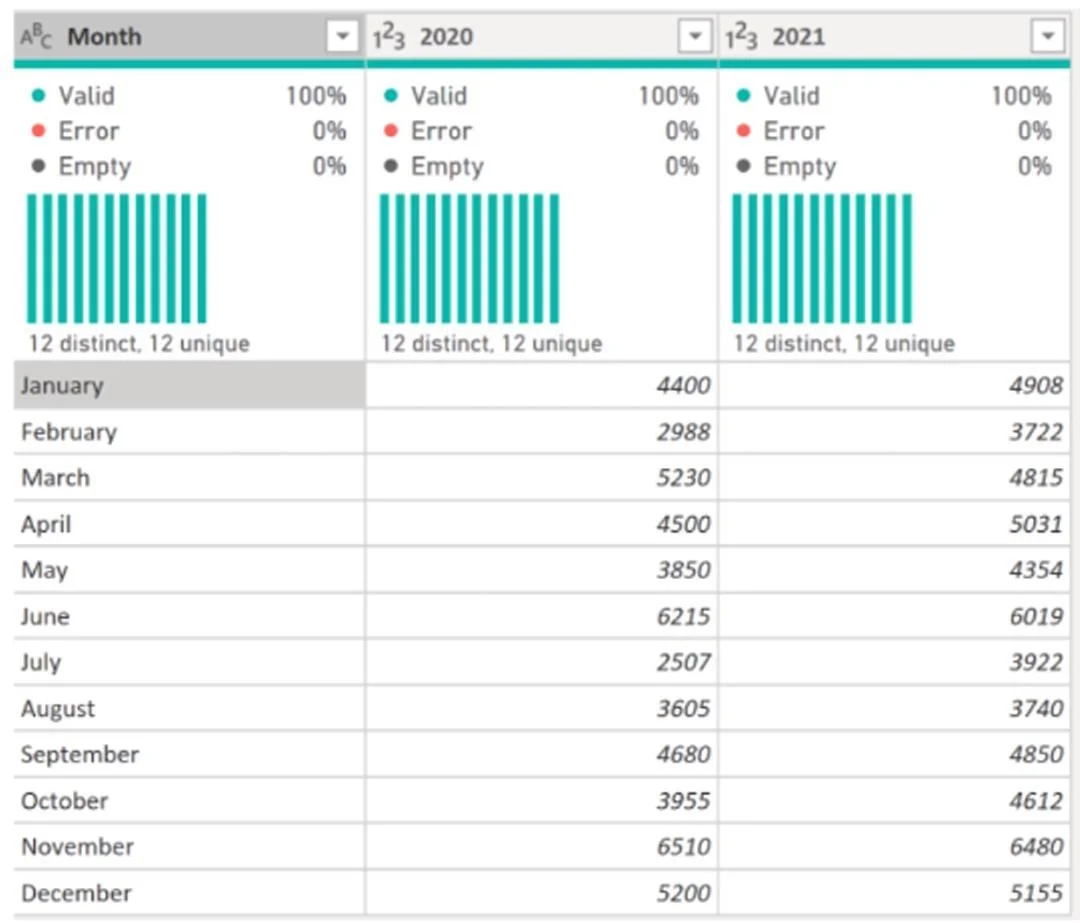
You use Power Query Editor to import and preview sales data from the years 2020 and 2021 in a Microsoft Excel file as shown in the following exhibit. You need to shape the query to display the…
The correct answer is C. Unpivot columns. The source data is in a pivoted format where year columns (2020, 2021) are spread across the top, with months as rows. The target shape requires three columns: Month, Sales, and Year - meaning the year column headers must become row values. This is an unpivot operation (C)…
Question
You use Power Query Editor to import and preview sales data from the years 2020 and 2021 in a Microsoft Excel file as shown in the following exhibit. You need to shape the query to display the following three columns:
- Month
- Sales
- Year
What should you select in Power Query Editor?
Exhibit
Options
- AMerge columns
- BTranspose
- CUnpivot columns
- DPivot column
How the community answered
(35 responses)- A3% (1)
- B6% (2)
- C80% (28)
- D11% (4)
Explanation
The source data is in a pivoted format where year columns (2020, 2021) are spread across the top, with months as rows. The target shape requires three columns: Month, Sales, and Year - meaning the year column headers must become row values. This is an unpivot operation (C): selecting the year columns and choosing 'Unpivot Columns' in Power Query Editor converts each column header into a value in a new 'Year' column and its corresponding cell value into a 'Sales' column. Pivot Column (D) does the opposite - it turns row values into columns. Transpose (B) rotates the entire table's axes but does not produce the required three-column structure. Merge Columns (A) concatenates columns together, which is irrelevant here.
Community Discussion
No community discussion yet for this question.