
PL-300 · Question #207
You maintain a Power Bl workspace that contains a supplier quality dashboard. The dashboard contains 10 card visuals, two map visuals and five bar chart visuals. The dashboard mobile layout is shown…
The correct answer is D. Decrease the size of the card visuals. Remove the map and bar chart visuals. To modify the dashboard mobile layout to show only single-value visuals and minimize scrolling, remove map and bar chart visuals and decrease the size of card visuals.
Question
You maintain a Power Bl workspace that contains a supplier quality dashboard. The dashboard contains 10 card visuals, two map visuals and five bar chart visuals. The dashboard mobile layout is shown in the exhibit. You need to modify the dashboard mobile layout to meet the following requirements:
- Only show single-value visuals.
- Minimize scrolling.
What should you do?
Exhibit
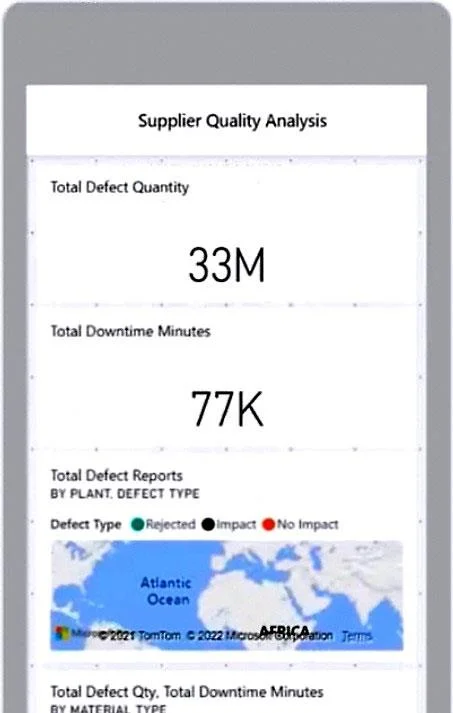
Options
- ARemove the card visual, increase the size of the map and bar chart visuals
- BDecrease the size of the map and bar chart visuals Move all the card visuals to the top of the
- CMove the bar chart visuals to the top of the layout Remove the map visuals. Decrease the size of
- DDecrease the size of the card visuals. Remove the map and bar chart visuals.
How the community answered
(18 responses)- A6% (1)
- B11% (2)
- C6% (1)
- D78% (14)
Why each option
To modify the dashboard mobile layout to show only single-value visuals and minimize scrolling, remove map and bar chart visuals and decrease the size of card visuals.
This option removes single-value visuals, keeps non-single-value visuals, and increases size, which would worsen scrolling rather than minimize it.
This option fails the requirement to show only single-value visuals by keeping map and bar chart visuals in the layout.
This option fails the requirement to show only single-value visuals by keeping bar chart visuals in the layout.
This solution directly meets both requirements: removing map and bar chart visuals ensures only single-value visuals (cards) are displayed, and decreasing the size of card visuals helps minimize scrolling by fitting more content on the screen.
Concept tested: Power BI dashboard mobile layout customization
Source: https://learn.microsoft.com/power-bi/create-reports/service-create-mobile-optimized-report-layout
Topics
Community Discussion
No community discussion yet for this question.