
DP-300 · Question #406
Hotspot Question You have a logical server for Azure SQL Database named Server1 that has an elastic pool named Pool1. You have a database watcher named Watcher1. You run the following KQL query. let…
The correct answer is The query returns the execution time of individual queries. = No; The query returns the resource consumption metrics from the last day. = Yes; The query visualizes the result set and includes a legend for each series. = No. This hotspot question tests understanding of a KQL query against Azure SQL Database Watcher data, specifically the sqldb_elastic_pool_resource_utilization table, and what results/behaviors the query produces given its filters and projections.
Question
Exhibit
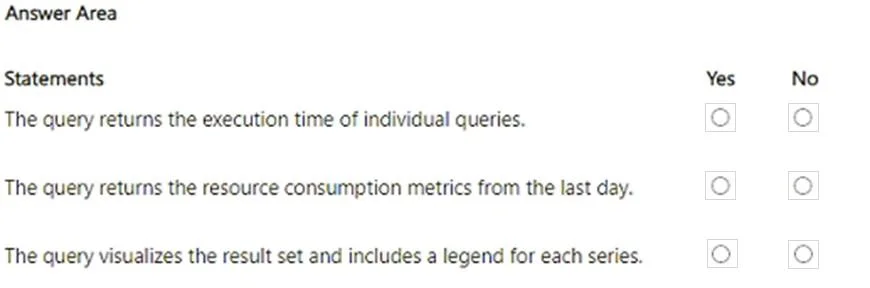
Answer Area
- The query returns the execution time of individual queries.No
- The query returns the resource consumption metrics from the last day.Yes
- The query visualizes the result set and includes a legend for each series.No
Explanation
This hotspot question tests understanding of a KQL query against Azure SQL Database Watcher data, specifically the sqldb_elastic_pool_resource_utilization table, and what results/behaviors the query produces given its filters and projections.
Approach. The query filters the sqldb_elastic_pool_resource_utilization table for the last 20 hours, targeting logical server 'Server1' and replica type 'Primary'. Notably, the query defines 'elacticPoolName' as a variable but NEVER uses it as a filter - meaning the query returns data for ALL elastic pools on Server1, not just Pool1. The projected columns (avg_cpu_percent, avg_instance_cpu_percent, avg_data_io_percent, avg_log_write_percent, max_worker_percent) reflect pool-level resource utilization metrics, and the 'render timechart' directive outputs a time-based chart. Because elastic_pool_name is not filtered, Statement 1 (query returns data only for Pool1) = No. The query does project avg_cpu_percent among other metrics, so any statement about CPU utilization being included = Yes. The render timechart will produce a visual chart output = Yes. The variable 'elacticPoolName' is declared but unused in the where clauses, which is the key trick in this question.
Concept tested. Understanding of KQL query construction for Azure Database Watcher, including variable declaration vs. usage, table schema for sqldb_elastic_pool_resource_utilization, and the effect of missing filter clauses (elastic_pool_name is declared but not applied as a where condition).
Reference. https://learn.microsoft.com/en-us/azure/azure-sql/database/database-watcher-overview
Topics
Community Discussion
No community discussion yet for this question.