
iSQI
CTAL-TM_UK · Question #46
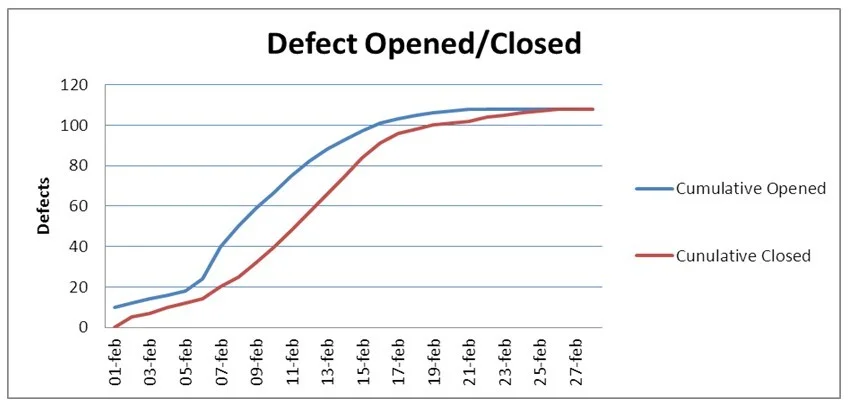
The following chart plots the cumulative number of defects opened against the cumulative number of defects closed during system testing of a software product. Which of the following statements is…
Sign in or unlock CTAL-TM_UK to reveal the answer and full explanation for question #46. The question stem and answer options stay visible for context.
Question
The following chart plots the cumulative number of defects opened against the cumulative number of defects closed during system testing of a software product. Which of the following statements is true?
Exhibit
Options
- AThe chart indicates that you have plenty of problems left to find
- BThe chart can be used to reveal test progress problems
- CThe chart seems to indicate that the defect management process is not working well
- DThe chart seems to indicate that the defect management process is working well
Unlock CTAL-TM_UK to see the answer
You've previewed enough free CTAL-TM_UK questions. Unlock CTAL-TM_UK for full answers, explanations, the timed quiz mode, progress tracking, and the master PDF. Question stem and options stay visible so you can still see what's on the exam.