
iSQI
CTAL-TM_UK · Question #26
After the presentation, you are asked to explain the chart. Assume you have applied a full risk-based testing strategy. Which of the following answers would you expect to best describe the pie chart?
Sign in or unlock CTAL-TM_UK to reveal the answer and full explanation for question #26. The question stem and answer options stay visible for context.
Question
After the presentation, you are asked to explain the chart. Assume you have applied a full risk-based testing strategy. Which of the following answers would you expect to best describe the pie chart?
Exhibit
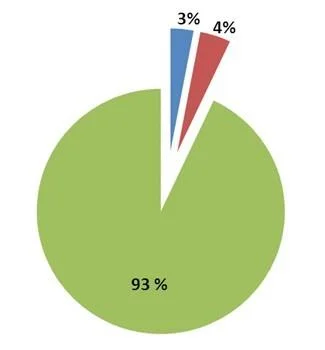
Options
- AAll the risk items have been covered with tests. No more risk items remain to test
- BAccording to the full risk-based testing strategy applied, it is very likely that the highest-risk
- COnly the lowest-risk items, tests and bugs should remain in the blue and red areas.
- D97 percent of the risk items has been tested. No open bugs or test failures remain.
Unlock CTAL-TM_UK to see the answer
You've previewed enough free CTAL-TM_UK questions. Unlock CTAL-TM_UK for full answers, explanations, the timed quiz mode, progress tracking, and the master PDF. Question stem and options stay visible so you can still see what's on the exam.