
CSSGB · Question #91
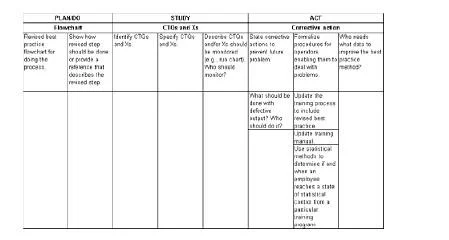
Explain the purpose of a QC process chart. Draw a QC chart to illustrate your explanation. Answer: The purpose of a QC process chart is to monitor implementation of revised best practice method.
The correct answer is A. Bottom line results. Option A is correct because a QC process chart is designed to track bottom line results - the measurable performance outputs of a process over time - to determine whether implementing a revised best practice method is actually producing improvement. These results are plotted…
Question
Explain the purpose of a QC process chart. Draw a QC chart to illustrate your explanation. Answer:
The purpose of a QC process chart is to monitor implementation of revised best practice method.
Exhibit
Options
- ABottom line results
- BMarket share growth
- CDefect reductions
- DCustomer focus
How the community answered
(32 responses)- A94% (30)
- B3% (1)
- D3% (1)
Explanation
Option A is correct because a QC process chart is designed to track bottom line results - the measurable performance outputs of a process over time - to determine whether implementing a revised best practice method is actually producing improvement. These results are plotted against control limits (upper and lower), giving a visual baseline to judge if the change is effective.
Option B (Market share growth) is wrong because market share is an external competitive metric, not an internal process quality measure - QC charts live inside the operation, not in the marketplace. Option C (Defect reductions) is tempting but wrong; while defects may appear on a QC chart, defect reduction is an outcome, not the purpose of the chart itself - the chart monitors overall process results, of which defects are just one possible data point. Option D (Customer focus) is wrong because it describes a business philosophy or strategy, not a quantifiable metric that can be charted.
Memory tip: Think of a QC chart as a scoreboard for your process - just like a game's final score is the "bottom line," the QC chart shows whether your process changes are moving the numbers in the right direction.
Topics
Community Discussion
No community discussion yet for this question.