
AZ-400 · Question #461
Hotspot Question You are using Agile process methodologies in Azure DevOps. You need to deploy a dashboard that will provide progress reports for the following work items: - How long it took to…
This question tests knowledge of Azure DevOps dashboard widgets specifically related to Agile flow metrics - Lead Time and Cycle Time widgets, which measure different phases of work item completion.
Question
Exhibit
Answer Area
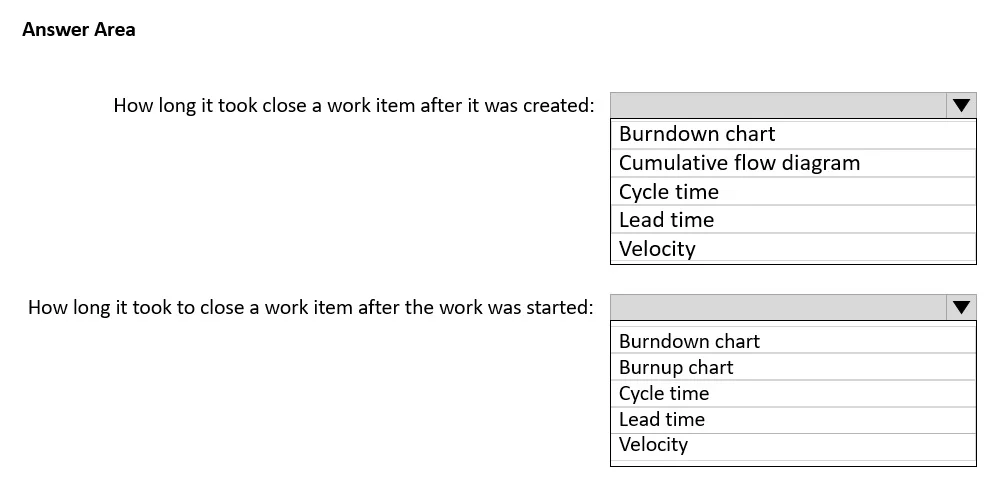
- How long it took close a work item after it was created:Burndown chartCumulative flow diagramCycle timeLead timeVelocity
- How long it took to close a work item after the work was started:Burndown chartBurnup chartCycle timeLead timeVelocity
Explanation
This question tests knowledge of Azure DevOps dashboard widgets specifically related to Agile flow metrics - Lead Time and Cycle Time widgets, which measure different phases of work item completion.
Approach. For 'how long it took to close a work item after it was CREATED,' the correct widget is the Lead Time widget. Lead Time measures the total elapsed time from when a work item is created to when it is closed, representing the full lifecycle from request to delivery. For 'how long it took to close a work item after the WORK WAS STARTED,' the correct widget is the Cycle Time widget. Cycle Time measures the elapsed time from when work actively begins (i.e., the item moves to an 'active' or in-progress state) to when it is closed, focusing only on the active work phase. Both widgets are available in Azure Boards and are part of the Analytics-based widgets used in Agile reporting.
Concept tested. Azure DevOps Agile metrics: understanding the distinction between Lead Time (creation to closure) and Cycle Time (work started to closure) widgets in Azure Boards dashboards, which are key flow metrics for measuring team efficiency and delivery performance.
Topics
Community Discussion
No community discussion yet for this question.