
Microsoft
70-779 · Question #109
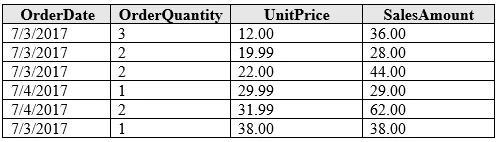
You have the following data sample. You need to create a PivotTable that presents the data as shown in the following table. What should you do?
Sign in or unlock 70-779 to reveal the answer and full explanation for question #109. The question stem and answer options stay visible for context.
Visualize data by using Microsoft Excel
Question
You have the following data sample. You need to create a PivotTable that presents the data as shown in the following table. What should you do?
Exhibit
Options
- ACreate a PivotTable. Add UnitPrice to the Rows area and add SalesAmount to the Values area.
- BCreate a PivotTable. Add SalesAmount to the Rows area and add UnitPrice to the Values area.
- CCreate a PivotTable. Add UnitPrice to the Rows area and add SalesAmount to the Values area.
- DCreate a PivotTable. Add SalesAmount to the Rows area and add UnitPrice to the Values area.
Unlock 70-779 to see the answer
You've previewed enough free 70-779 questions. Unlock 70-779 for full answers, explanations, the timed quiz mode, progress tracking, and the master PDF. Question stem and options stay visible so you can still see what's on the exam.
Topics
#PivotTable#Rows area#Values area#field placement