
70-779 · Question #59
Note: This question is part of a series of questions that use the same scenario. For your convenience, the scenario is repeated in each question. Each question presents a different goal and answer…
Sign in or unlock 70-779 to reveal the answer and full explanation for question #59. The question stem and answer options stay visible for context.
Question
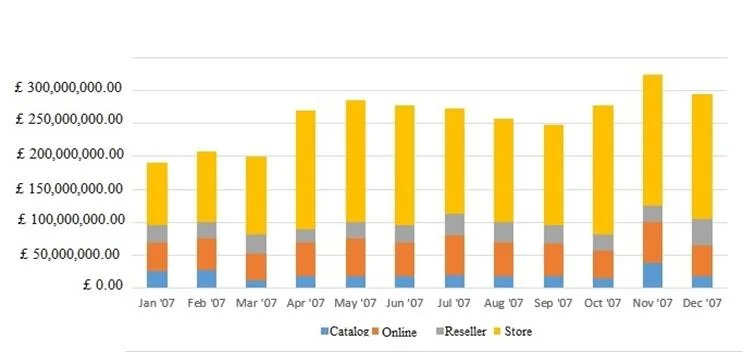
Note: This question is part of a series of questions that use the same scenario. For your convenience, the scenario is repeated in each question. Each question presents a different goal and answer choices, but the text of the scenario is the same in each question in this series. Start of repeated scenario. You have six workbook queries that each extracts a table from a Microsoft Azure SQL database. The tables are loaded to the data model, but the data is not loaded to any worksheets. The data model is shown in the Data Model exhibit. (Click the Exhibit button.) Your company has 100 product subcategories and more than 10,000 products. End of repeated scenario. You need to create a chart as shown in the following exhibit. Which type or chat should you use?
Exhibit
Options
- ALine with markers
- Bclustered column
- Cstacked column
- Dcombo
Unlock 70-779 to see the answer
You've previewed enough free 70-779 questions. Unlock 70-779 for full answers, explanations, the timed quiz mode, progress tracking, and the master PDF. Question stem and options stay visible so you can still see what's on the exam.