
VCP550 · Question #13
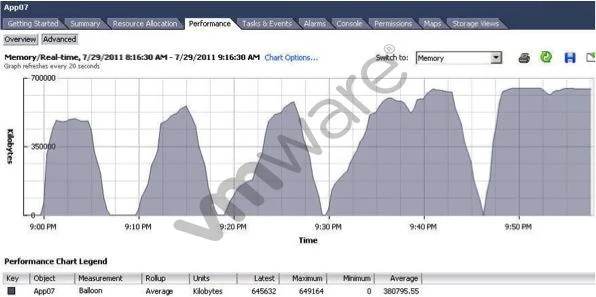
What is portrayed in the performance chart?
The correct answer is D. The ESXi host running the VM is low on memory. A performance chart showing host-level memory pressure indicators (ballooning, swapping) points to the ESXi host being low on physical memory, not an isolated VM configuration issue.
Question
What is portrayed in the performance chart?
Exhibit
Options
- AThe ESXi host running the VM has Transparent Page Sharing enabled.
- BThe virtual machine's memory share value is set too high.
- CThe virtual machine is memory constrained.
- DThe ESXi host running the VM is low on memory.
How the community answered
(28 responses)- A18% (5)
- B11% (3)
- C4% (1)
- D68% (19)
Why each option
A performance chart showing host-level memory pressure indicators (ballooning, swapping) points to the ESXi host being low on physical memory, not an isolated VM configuration issue.
Transparent Page Sharing (TPS) is a memory-saving feature that deduplicates identical memory pages; its activity does not appear as a constraint or pressure indicator in performance charts.
A memory share value that is too high would give the VM higher priority during contention, which would actually improve its performance relative to other VMs rather than indicate a problem.
An individual VM being memory constrained is a downstream effect of host-level pressure; the performance chart displays host-level counters that identify the root cause as the host, not the VM in isolation.
When an ESXi host runs low on physical memory, it activates memory reclamation techniques such as the balloon driver and memory swapping, which are visible as distinct activity spikes in performance charts. These metrics are host-scope counters that rise when aggregate VM demand exceeds available host RAM. The chart therefore reflects a host-wide memory shortage rather than a single VM's configuration.
Concept tested: ESXi host memory pressure interpretation in performance charts
Source: https://docs.vmware.com/en/VMware-vSphere/7.0/com.vmware.vsphere.monitoring.doc/GUID-07B1B8A4-6E37-4D2B-AF0C-CB9E1A07A7D7.html
Topics
Community Discussion
No community discussion yet for this question.