
PL-300 · Question #420
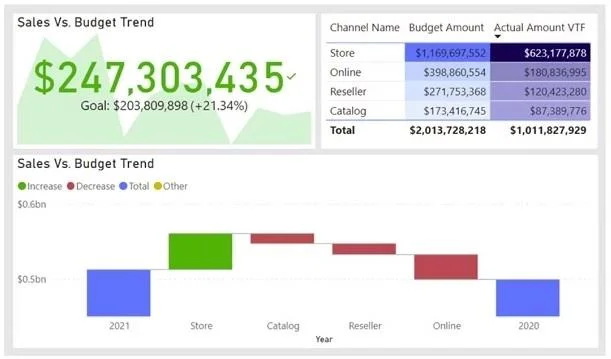
You are configuring a Power BI report for accessibility as shown in the following table. You need to change the default colors of all three visuals to make the report more accessible to users who…
The correct answer is B. Theme colors C. Divergent colors. To make a Power BI report more accessible for users with color vision deficiency by changing visual colors, you should configure theme colors and divergent colors in the Customize theme window.
Question
You are configuring a Power BI report for accessibility as shown in the following table. You need to change the default colors of all three visuals to make the report more accessible to users who have color vision deficiency. Which two settings should you configure in the Customize theme window? Each correct answer presents part of the solution. NOTE: Each correct selection is worth one point.
Exhibit
Options
- AFirst-level elements colors
- BTheme colors
- CDivergent colors
- DSentiment colors
How the community answered
(33 responses)- A9% (3)
- B79% (26)
- D12% (4)
Why each option
To make a Power BI report more accessible for users with color vision deficiency by changing visual colors, you should configure theme colors and divergent colors in the Customize theme window.
First-level elements colors is not a standard theme setting category for general visual colors in Power BI; 'Theme colors' covers the overall palette.
Theme colors are the primary palette used across all visuals and elements in a Power BI report, directly controlling the default colors for accessibility by defining the foundational color scheme.
Divergent colors are specifically used for conditional formatting scales or visuals that show a range from one extreme to another, and adjusting these is crucial for ensuring accessibility for color vision deficiency in such data representations.
Sentiment colors are a specific application of colors (e.g., red for negative, green for positive) rather than a general setting category within the theme customization window for overall report accessibility.
Concept tested: Power BI theme customization for accessibility
Source: https://learn.microsoft.com/en-us/power-bi/create-reports/service-accessibility-create-reports#use-accessible-themes-colors-and-formatting
Community Discussion
No community discussion yet for this question.