
PL-300 · Question #250
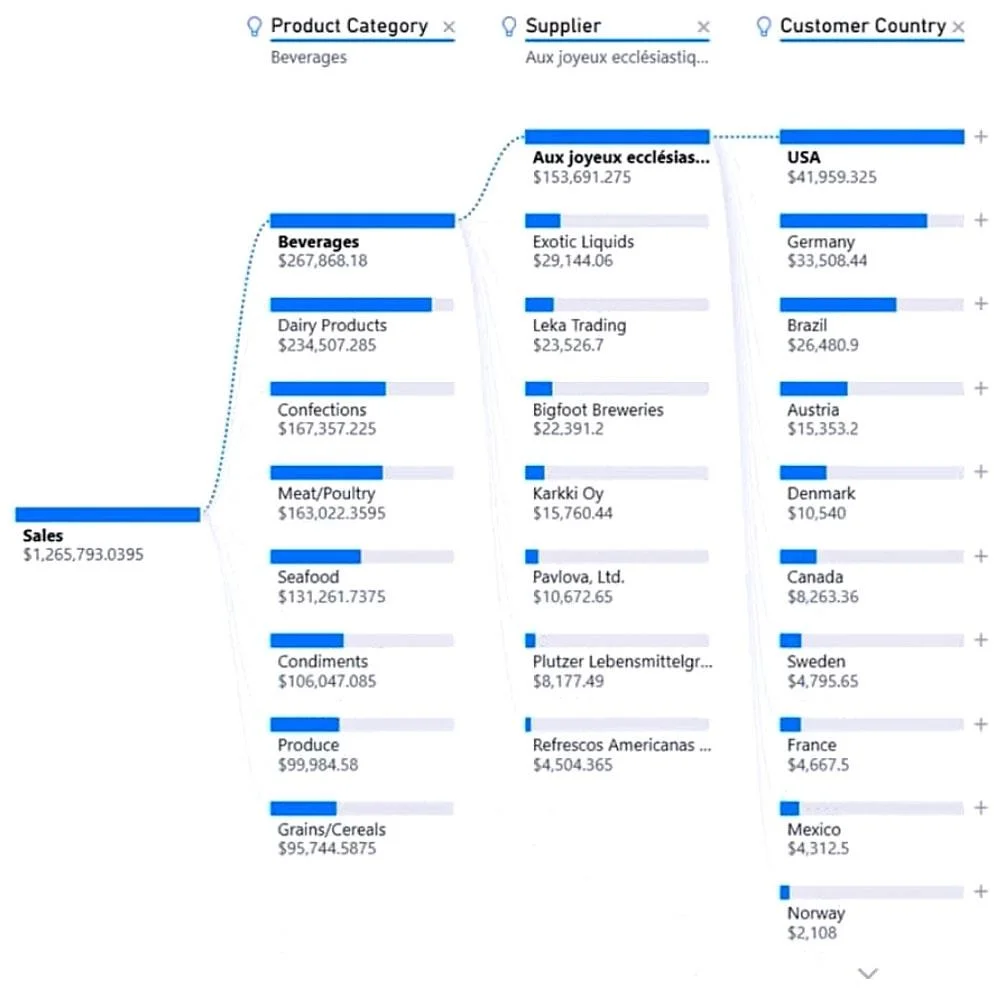
You need to create a visual that enables the adhoc exploration of data as shown in the following exhibit. Which type of visual should you use?
The correct answer is B. decomposition tree. The decomposition tree visual in Power BI lets you visualize data across multiple dimensions. It automatically aggregates data and enables drilling down into your dimensions in any order. It is also an artificial intelligence (AI) visualization, so you can ask it to find the…
Question
You need to create a visual that enables the adhoc exploration of data as shown in the following exhibit. Which type of visual should you use?
Exhibit
Options
- AQ&A
- Bdecomposition tree
- Csmart narrative
- Dkey influencers
How the community answered
(24 responses)- A8% (2)
- B71% (17)
- C4% (1)
- D17% (4)
Explanation
The decomposition tree visual in Power BI lets you visualize data across multiple dimensions. It automatically aggregates data and enables drilling down into your dimensions in any order. It is also an artificial intelligence (AI) visualization, so you can ask it to find the next dimension to drill down into based on certain criteria. This makes it a valuable tool for ad hoc exploration and conducting root cause analysis. https://docs.microsoft.com/en-us/power-bi/visuals/power-bi-visualization-decomposition-tree
Community Discussion
No community discussion yet for this question.