
PL-300 · Question #248
You have a Power Bl report hosted on powerbi.com that displays expenses by department for department managers. The report contains a line chart that shows expenses by month. You need to enable users…
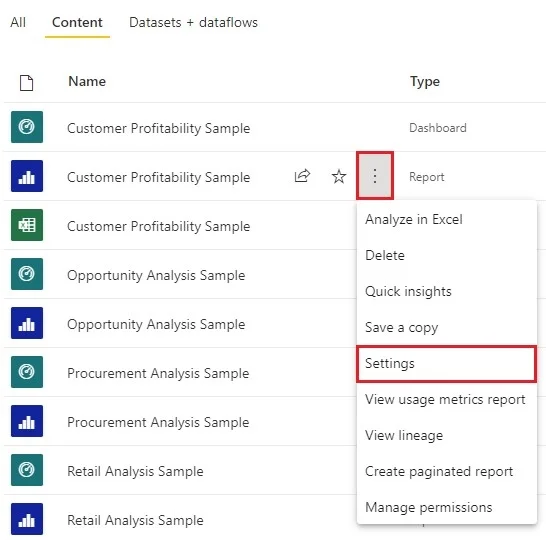
The correct answer is D. Enable report readers to personalize visuals. Let users personalize visuals in a report Enable personalization in a report You can enable the feature either in Power BI Desktop or the Power BI service. You can also enable it in embedded reports. To enable the feature in the Power BI (powerbi.com) service, go to Settings…
Question
You have a Power Bl report hosted on powerbi.com that displays expenses by department for department managers. The report contains a line chart that shows expenses by month. You need to enable users to choose between viewing the report as a line chart or a column chart. The solution must minimize development and maintenance effort. What should you do?
Exhibit
Options
- AAdd a column chart, a bookmark, and a button for users to choose a visual.
- BCreate a mobile report that contains a column chart.
- CCreate a separate report page for users to view the column chart.
- DEnable report readers to personalize visuals.
How the community answered
(54 responses)- A4% (2)
- B13% (7)
- C9% (5)
- D74% (40)
Explanation
Let users personalize visuals in a report Enable personalization in a report You can enable the feature either in Power BI Desktop or the Power BI service. You can also enable it in embedded reports. To enable the feature in the Power BI (powerbi.com) service, go to Settings for your report. Turn on Personalize visuals > Save. https://docs.microsoft.com/en-us/power-bi/create-reports/power-bi-personalize- visuals?tabs=powerbi-service#enable-personalization-in-a-report
Community Discussion
No community discussion yet for this question.