
PL-100 · Question #217
Drag and Drop Question A call center manager monitors incoming phone calls. The manager analyzes the performance of phone reps by using a custom view. The view contains a custom field named Phone…
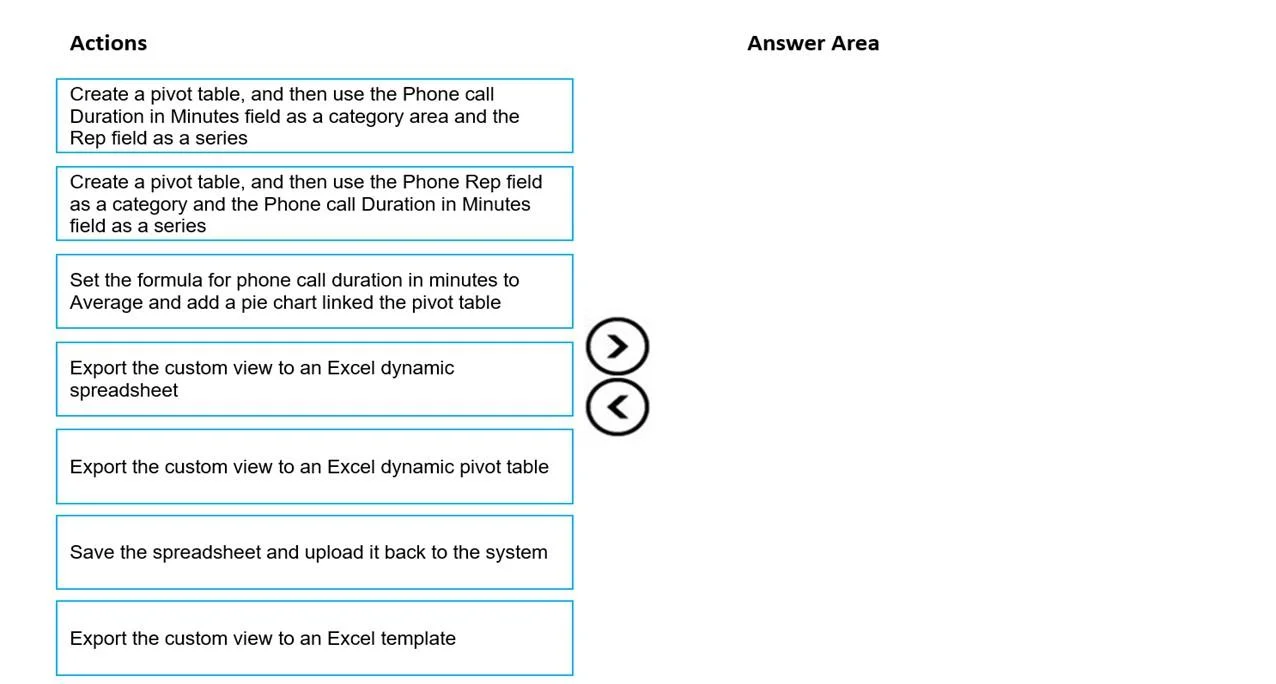
The correct answer is Export the custom view to an Excel dynamic pivot table; Create a pivot table, and then use the Phone call Duration in Minutes field as a category and the Phone Rep field as a series; Set the formula for phone-call duration in minutes to Average and add a pie chart linked to the pivot table; Save the spreadsheet and upload it back to the system. The solution involves exporting a custom view as an Excel dynamic pivot table, configuring its fields to analyze rep performance, calculating average call duration with a chart, and then saving and uploading the spreadsheet.
Question
Exhibit
Answer Area
Drag items
Correct arrangement
- Export the custom view to an Excel dynamic pivot table
- Create a pivot table, and then use the Phone call Duration in Minutes field as a category and the Phone Rep field as a series
- Set the formula for phone-call duration in minutes to Average and add a pie chart linked to the pivot table
- Save the spreadsheet and upload it back to the system
Explanation
The solution involves exporting a custom view as an Excel dynamic pivot table, configuring its fields to analyze rep performance, calculating average call duration with a chart, and then saving and uploading the spreadsheet.
Approach. The core requirement is to create an Excel spreadsheet daily for trending analysis of call center performance, specifically focusing on 'Phone call Duration in Minutes' by 'Phone Reps'.
-
Export the custom view to an Excel dynamic pivot table: The most efficient way to achieve daily trending analysis is to export data directly into an Excel dynamic pivot table. This type of export connects the Excel file to the source system, allowing the data in the pivot table to be refreshed easily. It provides immediate analytical capabilities, which is crucial for trending.
-
Create a pivot table, and then use the Phone Rep field as a category and the Phone call Duration in Minutes field as a series: After exporting as a dynamic pivot table, the next logical step is to configure the pivot table fields to analyze rep performance. Placing 'Phone Rep' as a category (e.g., rows or columns) and 'Phone call Duration in Minutes' as a series (e.g., values) allows for easy comparison and aggregation of call durations per rep. The wording 'Create a pivot table' here refers to defining the layout and fields within the already exported dynamic pivot table, not creating a new one from scratch.
-
Set the formula for phone call duration in minutes to Average and add a pie chart linked the pivot table: For performance analysis, the total duration might be less useful than the average duration per call or per rep. Setting the aggregation for 'Phone call Duration in Minutes' to 'Average' provides a meaningful metric. Adding a pie chart (or any suitable chart type) linked to the pivot table enhances visualization, making the data easier to present and interpret for trending analysis and corrective actions.
-
Save the spreadsheet and upload it back to the system: The final step involves saving the created and configured spreadsheet. Uploading it back to the system (e.g., a CRM, SharePoint, or a document management system) ensures that the report is accessible to upper management for review and further actions, potentially centralizing the reports for easy access and historical tracking.
Common mistakes.
- common_mistake. 1. Export the custom view to an Excel dynamic spreadsheet (instead of dynamic pivot table): While this option provides raw data that can be refreshed, it requires manual creation of a pivot table and chart afterward, adding extra steps and complexity compared to directly exporting a dynamic pivot table. The goal is efficiency for a daily task. It would be an extra step compared to exporting directly into a pivot table.
- Create a pivot table, and then use the Phone call Duration in Minutes field as a category area and the Rep field as a series (instead of Rep as category and Duration as series): Swapping the category and series fields would typically make the analysis less intuitive for comparing individual rep performance. Having call durations as categories would mean grouping data by specific durations, rather than by reps to see their average durations.
- Export the custom view to an Excel template: This action would export an empty template structure, not the actual data required for daily performance analysis.
- Not setting average or adding a chart: Without calculating an average or visualizing the data with a chart, the spreadsheet might be less effective for quick analysis and presentation to upper management.
Concept tested. Data export and reporting functionalities in enterprise applications (e.g., CRM or Dynamics 365), specifically leveraging Excel dynamic pivot tables for data analysis, visualization, and ongoing reporting.
Topics
Community Discussion
No community discussion yet for this question.