PL-100 · Question #102
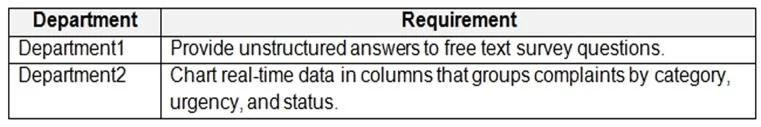
Drag and Drop Question You are an app and report maker. You provide visualizations for two departments in an organization. Each department requires department-specific visualizations: You need to…
The correct answer is Tag; Multi-series. A tag chart effectively visualizes unstructured text data, while a multi-series column chart is best suited for comparing data grouped by multiple categories.
Question
Exhibit
Answer Area
Drag items
Correct arrangement
- Tag
- Multi-series
Explanation
A tag chart effectively visualizes unstructured text data, while a multi-series column chart is best suited for comparing data grouped by multiple categories.
Approach. To answer the question correctly, the following interactions are required:
- For the requirement 'Unstructured answers to free text survey questions,' drag the 'Tag' chart type to the corresponding drop zone. A tag chart, commonly known as a word cloud, is specifically designed to visualize the frequency and prominence of keywords within unstructured text data, making it ideal for this purpose.
- For the requirement 'Real-time column chart that groups complaints by category, urgency, and status,' drag the 'Multi-series' chart type to the corresponding drop zone. A multi-series column chart (also known as a clustered column chart) allows for displaying and comparing multiple distinct data series (representing categories, urgency levels, and statuses) side-by-side within the same chart, which is highly effective for breaking down and comparing data across several dimensions simultaneously in a column format.
Common mistakes.
- common_mistake. Using 'Stacked column' for the requirement to 'Chart real-time data in columns that groups complaints by category, urgency, and status' would be incorrect because while it is a column chart, a stacked column chart is primarily used to show the composition of a total across different categories, or how different parts contribute to a whole. The requirement 'groups complaints by category, urgency, and status' implies comparing distinct groupings across these multiple attributes, which a multi-series (clustered) column chart handles more effectively for clear visual comparison. A stacked column chart would likely combine these attributes into a single stack, making direct comparison across individual attributes less clear. Using 'Multi-series' or 'Stacked column' for 'Unstructured answers to free text survey questions' is also incorrect because these chart types are designed for numerical, categorical, or temporal data, not for extracting and visualizing themes or frequencies from free-form text.
Concept tested. Understanding of data visualization best practices, appropriate chart type selection based on data characteristics (e.g., unstructured text versus grouped categorical data), and the analytical goal (e.g., identifying keyword frequency versus comparing multi-dimensional groups).
Topics
Community Discussion
No community discussion yet for this question.