
NSE6_SDW_AD-7.6 · Question #77
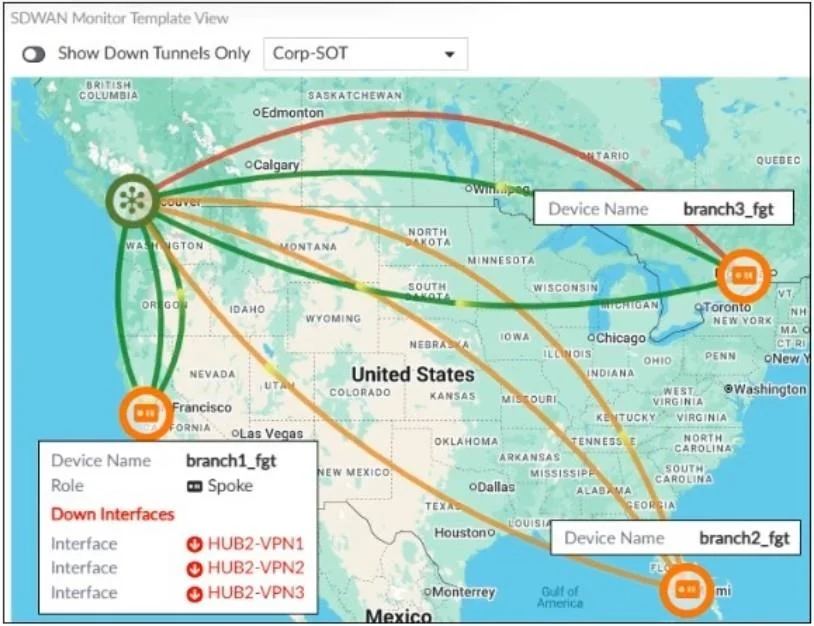
Refer to the exhibit. To check the status of an SD-WAN topology using the FortiManager SD- WAN monitor menus, you place your mouse next to branch1_fgt and receive the output shown in the exhibit…
The correct answer is D. The three spokes have tunnels that are out of SLA. In the FortiManager SD-WAN monitor, the red lines (HUB2-VPN1, HUB2-VPN2, HUB2-VPN3) indicate that the tunnels from branch1_fgt to its hubs are down or out of SLA. Since the monitor shows connections among multiple spokes (branch1_fgt, branch2_fgt, branch3_fgt), and the display…
Question
Refer to the exhibit. To check the status of an SD-WAN topology using the FortiManager SD- WAN monitor menus, you place your mouse next to branch1_fgt and receive the output shown in the exhibit. Which conclusion can you draw from the output shown in the exhibit? FortiManager SD-WAN monitor
Exhibit
Options
- Abranch3_fgt is configured with three SD-WAN overlay tunnels and one is dead.
- BThe template Corp-SOT defines a single-hub topology.
- CThree tunnels of branch2_fgt are out of SLA.
- DThe three spokes have tunnels that are out of SLA.
How the community answered
(43 responses)- A5% (2)
- B9% (4)
- C16% (7)
- D70% (30)
Explanation
In the FortiManager SD-WAN monitor, the red lines (HUB2-VPN1, HUB2-VPN2, HUB2-VPN3) indicate that the tunnels from branch1_fgt to its hubs are down or out of SLA. Since the monitor shows connections among multiple spokes (branch1_fgt, branch2_fgt, branch3_fgt), and the display highlights tunnel issues for each, the conclusion is that each spoke device has SD-WAN tunnels currently failing SLA compliance, not just a single device or hub.
Topics
Community Discussion
No community discussion yet for this question.