
MLS-C01 · Question #213
A Machine Learning Specialist is training a regression model to predict house prices in different locations. The Specialist wants to test the quality of the test data by identifying whether the…
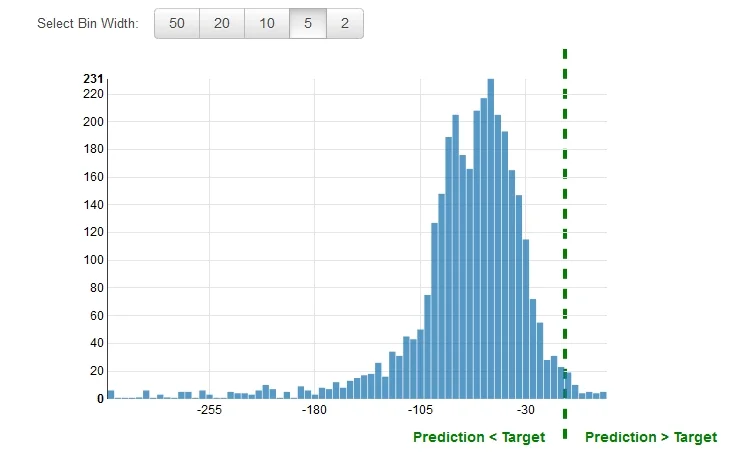
The correct answer is A. Residual plots. It is common practice to review the residuals for regression problems. A residual for an observation in the evaluation data is the difference between the true target and the predicted target. Residuals represent the portion of the target that the model is unable to predict. A…
Question
A Machine Learning Specialist is training a regression model to predict house prices in different locations. The Specialist wants to test the quality of the test data by identifying whether the model is underestimating or overestimating the target price. Which visualization technique should the Specialist use?
Exhibit
Options
- AResidual plots
- BConfusion matrix
- CCorrelation matrix
- DRoot Mean Square Error (RMSE)
How the community answered
(27 responses)- A85% (23)
- B7% (2)
- C4% (1)
- D4% (1)
Explanation
It is common practice to review the residuals for regression problems. A residual for an observation in the evaluation data is the difference between the true target and the predicted target. Residuals represent the portion of the target that the model is unable to predict. A positive residual indicates that the model is underestimating the target (the actual target is larger than the predicted target). A negative residual indicates an overestimation (the actual target is smaller than the predicted target). The histogram of the residuals on the evaluation data, when distributed in a bell shape and centered at zero, indicates that the model makes mistakes in a random manner and does not systematically over or under predict any particular range of target values. If the residuals do not form a zero-centered bell shape, there is some structure in the model’s prediction error.
Topics
Community Discussion
No community discussion yet for this question.