
MB-310 · Question #120
Drag and Drop Question A client plans to use financial statements in Dynamics 365 Finance. The client wants to process the statements by using various combinations of the components to create custom…
The correct answer is row definition; column definition; reporting tree; report definition. Dynamics 365 Finance: Financial Statement Report Components The question is missing the purpose descriptions (the left-side targets you drag onto), but the correct arrangement maps directly to the four standard Financial Reporter building blocks in D365 Finance. Here's what…
Question
Exhibit
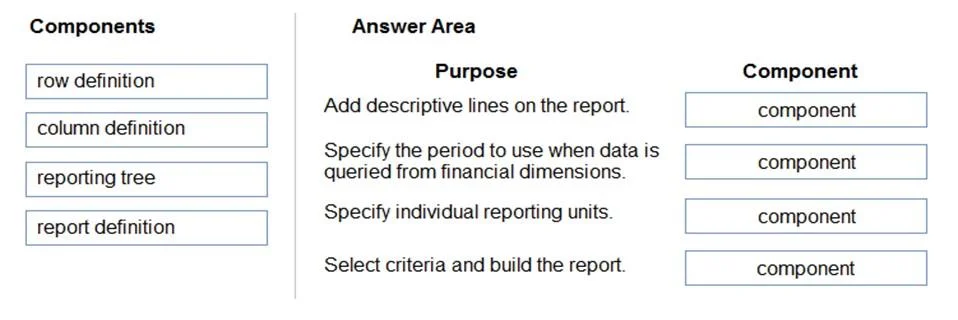
Answer Area
Drag items
Correct arrangement
- row definition
- column definition
- reporting tree
- report definition
Explanation
Dynamics 365 Finance: Financial Statement Report Components
The question is missing the purpose descriptions (the left-side targets you drag onto), but the correct arrangement maps directly to the four standard Financial Reporter building blocks in D365 Finance. Here's what each component does and why it's placed where it is.
The Four Building Blocks - Explained Individually
1. Row Definition
Purpose: Define what appears in each row of the report
Row definitions specify the content of each horizontal line - GL account ranges, totals, subtotals, descriptions, and formulas. Think of it as the vertical skeleton of a report.
- Maps accounts (e.g., 1000–1999 for Assets) to labeled rows
- Controls formatting like bold, underlines, spacing
- Can include calculated rows (e.g., Gross Profit = Revenue - COGS)
Common misconception: People confuse rows with "data." Rows define structure, not the actual numbers - the data is pulled from GL at runtime.
2. Column Definition
Purpose: Define what time periods or data types appear in each column
Column definitions control the horizontal layout - which periods, currencies, or calculation types (Actual, Budget, Variance) appear side by side.
- Specifies period offsets (e.g., current month, YTD, prior year)
- Controls currency display, rounding, and column widths
- Can include formula columns (e.g., Variance = Budget - Actual)
Common misconception: Columns are not just "dates." A single column can represent a calculation, a currency conversion, or a percentage - not just a fiscal period.
3. Reporting Tree
Purpose: Define the organizational hierarchy for consolidation
A reporting tree breaks the report down across business units, departments, or legal entities. It lets one report roll up data from multiple reporting units into a consolidated view.
- Each node in the tree = one reporting unit (e.g., a department or region)
- Parent nodes automatically sum child nodes
- Optional - only needed for multi-dimensional or consolidated reports
Common misconception: Many think this is required for all reports. It is optional - single-entity reports with no org hierarchy don't need a reporting tree at all.
4. Report Definition
Purpose: The master container that assembles all other components
The report definition is the orchestrator. It references a row definition, column definition, and (optionally) a reporting tree, then adds report-level settings.
- Sets the base period and fiscal year
- Points to which row, column, and tree definitions to use
- Controls output settings (PDF, Excel, etc.)
- Is the only component you actually generate/run
Common misconception: People think of the report definition as "just settings." In reality, it's the only component the system executes - the other three are inert building blocks until referenced here.
Summary Table
| # | Component | Role |
|---|---|---|
| 1 | Row Definition | What rows (accounts/totals) appear |
| 2 | Column Definition | What columns (periods/types) appear |
| 3 | Reporting Tree | Organizational hierarchy for rollup |
| 4 | Report Definition | Combines all blocks; the runnable report |
Key Takeaway
The first three components (row, column, tree) are independent, reusable building blocks. The report definition is what assembles them. This separation is intentional - you can mix and match the same row definition with different column definitions to produce multiple reports without duplication.
Topics
Community Discussion
No community discussion yet for this question.