
ISTQB-CTFL · Question #104
The following chart represents metrics related to testing of a project that was competed. Indicate what is represented by tie lines A, B and the axes X.Y A. B. C. D. Answer:
The correct answer is B. X - Time Y - Number of defects A - Number of open defects B - Number of closed defects. Option B is correct because the most common and meaningful test-progress chart plots open vs. closed defects over time - open defects (A) rise as testing uncovers bugs then fall as fixes are applied, while closed defects (B) steadily increase, producing the characteristic…
Question
Exhibit
Options
- AX - Time Y - Cost A - Cost of test (per week) B - Cost of finding a single bug (per week)
- BX - Time Y - Number of defects A - Number of open defects B - Number of closed defects
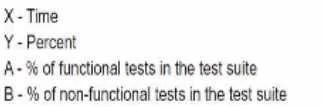
- CX - Time Y - Percent A - % of functional tests in the test suite B - % of non-functional tests in the test suite
- DX - Time Y - Count A - Total number of executed tests B - Number of open bugs
How the community answered
(19 responses)- A5% (1)
- B74% (14)
- C16% (3)
- D5% (1)
Explanation
Option B is correct because the most common and meaningful test-progress chart plots open vs. closed defects over time - open defects (A) rise as testing uncovers bugs then fall as fixes are applied, while closed defects (B) steadily increase, producing the characteristic crossing-line shape that signals a project nearing completion.
Why the distractors fail:
- A is wrong because cost-per-bug metrics are rarely plotted as two intersecting trend lines on a standard testing chart; they also wouldn't naturally cross in the way a completed-project chart implies.
- C is wrong because the ratio of functional to non-functional tests in a suite is typically fixed at planning time and doesn't evolve dynamically across the project timeline in this pattern.
- D is a common trap - total executed tests always rises monotonically and wouldn't cross an open-bugs line in a meaningful way, making the "tie lines" interpretation forced and unrealistic.
Memory tip: Think of the two lines as a pair of scissors closing - open bugs open wide at the start (as testers find issues) and closed bugs start near zero, but they cross and invert as the project wraps up. If the lines cross and close, the project is healthy. That "scissors closing" image locks in X = Time, Y = defect count, A = open, B = closed.
Topics
Community Discussion
No community discussion yet for this question.