
GSLC · Question #445
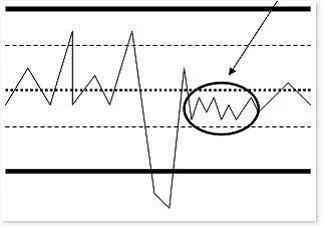
Consider the following diagram: What is the highlighted area of the diagram known as?
The correct answer is A. Rule of Seven. The Rule of Seven identifies when seven or more consecutive data points fall on the same side of the mean in a control chart, signaling a non-random pattern that requires investigation.
Question
Consider the following diagram:
What is the highlighted area of the diagram known as?
Exhibit
Options
- ARule of Seven
- BControl point
- CControl chart
- DSix Sigma
How the community answered
(57 responses)- A91% (52)
- B2% (1)
- C2% (1)
- D5% (3)
Why each option
The Rule of Seven identifies when seven or more consecutive data points fall on the same side of the mean in a control chart, signaling a non-random pattern that requires investigation.
The Rule of Seven is a statistical process control concept stating that a run of seven consecutive data points on one side of the centerline indicates an assignable cause rather than random variation. This pattern is highlighted in control charts to alert quality managers that the process has likely shifted and is no longer in statistical control. It is a standard tool in project quality management for identifying trends before they become critical defects.
A control point is a defined threshold or inspection gate in a process workflow, not the name for a pattern of consecutive data points on a control chart.
A control chart is the full diagram used to track process performance over time, not the term for the specific highlighted region of consecutive points within it.
Six Sigma is a broad quality improvement methodology aimed at reducing defects to 3.4 per million opportunities, not a label for any specific highlighted area on a control chart.
Concept tested: Rule of Seven in statistical process control quality
Topics
Community Discussion
No community discussion yet for this question.