
FCP_FAZ_AN-7.6 · Question #11
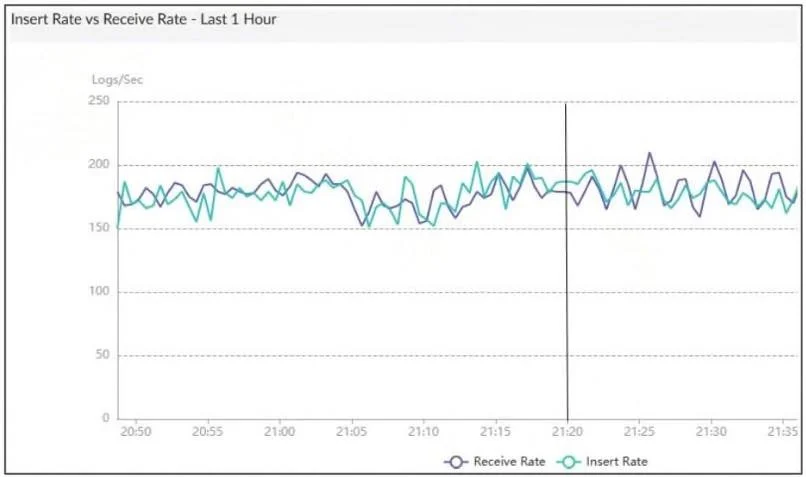
Refer to the exhibit. What does the data point at 21:20 indicate?
The correct answer is A. FortiAnalyzer is indexing logs faster than logs are being received. The exhibit shows a graph that tracks two metrics over time: Receive Rate and Insert Rate. These two rates are crucial for understanding the log processing behavior in FortiAnalyzer. Understanding Receive Rate and Insert Rate: Receive Rate: This is the rate at which…
Question
Refer to the exhibit. What does the data point at 21:20 indicate?
Exhibit
Options
- AFortiAnalyzer is indexing logs faster than logs are being received.
- BThe sqlpugind daemon is behind in receiving logs by one log.
- CThe fortilogd daemon is ahead in indexing by one log.
- DThe log insert lag time is high.
How the community answered
(33 responses)- A64% (21)
- B6% (2)
- C9% (3)
- D21% (7)
Explanation
The exhibit shows a graph that tracks two metrics over time: Receive Rate and Insert Rate. These two rates are crucial for understanding the log processing behavior in FortiAnalyzer. Understanding Receive Rate and Insert Rate: Receive Rate: This is the rate at which FortiAnalyzer is receiving logs from connected devices. Insert Rate: This is the rate at which FortiAnalyzer is indexing (inserting) logs into its database for storage and analysis. Data Point at 21:20: At 21:20, the Insert Rate line is above the Receive Rate line, indicating that FortiAnalyzer is inserting logs into its database at a faster rate than it is receiving them. This situation suggests that FortiAnalyzer is able to keep up with the incoming logs and is possibly processing a backlog or temporarily received logs faster than new logs are coming in.
Topics
Community Discussion
No community discussion yet for this question.