
Dell-EMC
E20-007 · Question #167
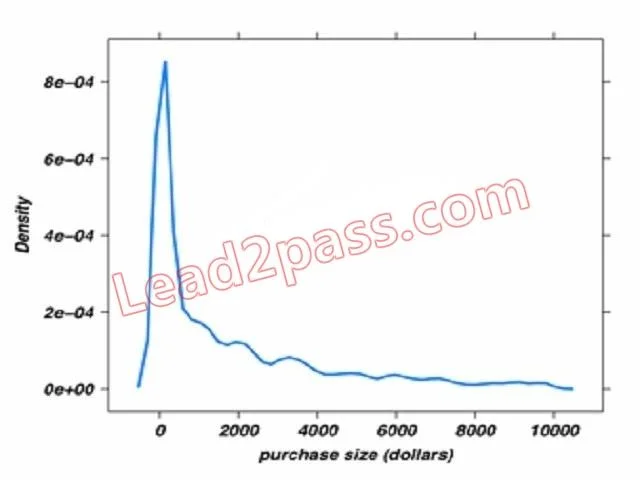
Refer to the exhibit. You have created a density plot of purchase amounts from a retail website as shown. What should you do next?
The correct answer is C. Recreate the density plot using a log normal distribution of the purchase amount data. See the full explanation below for the reasoning.
Question
Refer to the exhibit. You have created a density plot of purchase amounts from a retail website as shown. What should you do next?
Exhibit
Options
- ARecreate the plot using the barplot() function
- BUse the rug() function to add elements to the plot
- CRecreate the density plot using a log normal distribution of the purchase amount data
- DReduce the sample size of the purchase amount data used to create the plot
How the community answered
(30 responses)- A7% (2)
- B3% (1)
- C73% (22)
- D17% (5)
Community Discussion
No community discussion yet for this question.