
Dell-EMC
E20-007 · Question #166
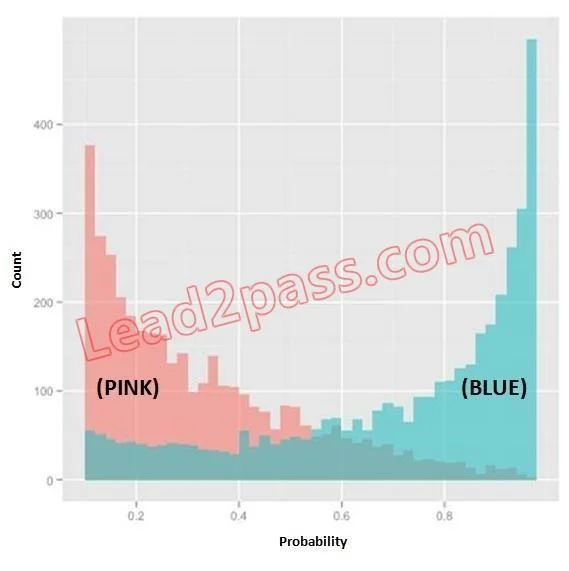
Refer to the exhibit. In the exhibit, the x-axis represents the derived probability of a borrower defaulting on a loan. Also in the exhibit, the pink represents borrowers that are known to have not…
The correct answer is A. Logistic Regression. See the full explanation below for the reasoning.
Question
Refer to the exhibit. In the exhibit, the x-axis represents the derived probability of a borrower defaulting on a loan. Also in the exhibit, the pink represents borrowers that are known to have not defaulted on their loan, and the blue represents borrowers that are known to have defaulted on their loan. Which analytical method could produce the probabilities needed to build this exhibit?
Exhibit
Options
- ALogistic Regression
- BLinear Regression
- CDiscriminant Analysis
- DAssociation Rules
How the community answered
(42 responses)- A71% (30)
- B5% (2)
- C17% (7)
- D7% (3)
Community Discussion
No community discussion yet for this question.